- There was a nice upward move in bitcoin price from the $6,435 low against the US Dollar.
- The price is now trading nicely above the $7,000 and $6,960 support levels.
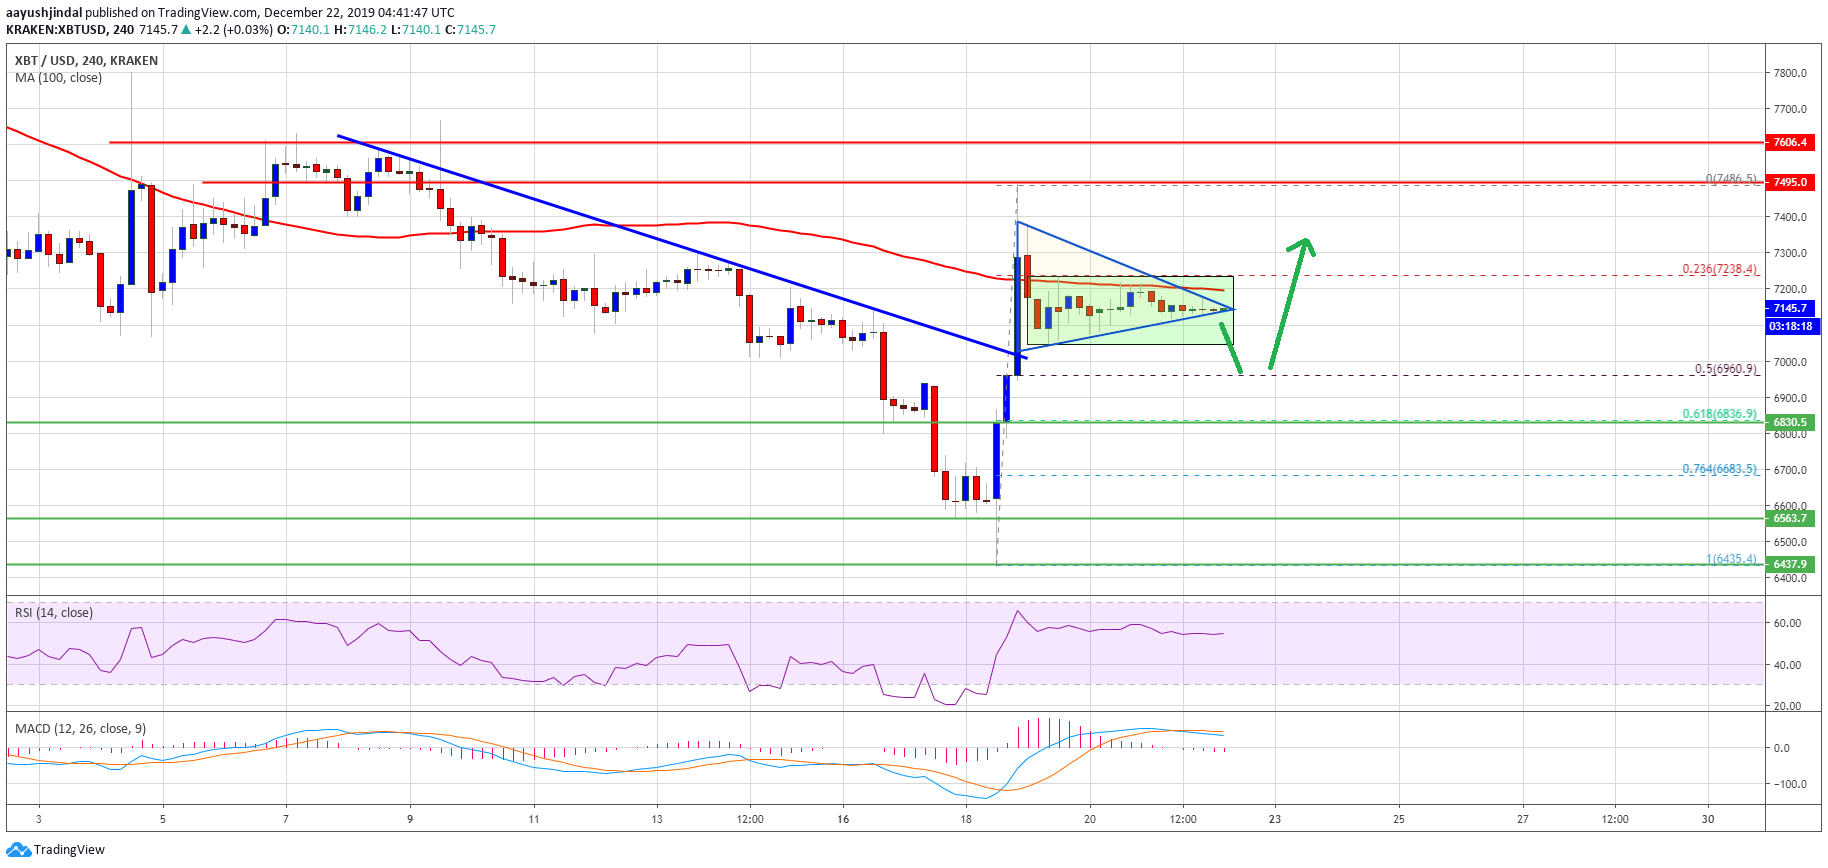
- There is likely a bullish continuation pattern forming resistance near $7,180 on the 4-hours chart of the BTC/USD pair (data feed from Kraken).
- The price could decline a few points before it starts a fresh increase above the $7,300 resistance.
Bitcoin price is now trading in a positive zone above $7,000 against the US Dollar. BTC remains well supported on dips as long as there is no close below $6,830.
Bitcoin Price Weekly Analysis (BTC)
This past week, bitcoin started a strong recovery wave from the $6,400-$6,500 support area against the US Dollar. BTC price broke a few hurdles near the $7,000 level and the 100 simple moving average (4-hours).
Moreover, the price rallied above the $7,200 and $7,300 resistance levels. Finally, it traded close to the $7,500 resistance and a new weekly high was formed near the $7,486 level.
Later, bitcoin started a downside correction below the $7,300 level and the 100 simple moving average (4-hours). Besides, there was a break below the 23.6% Fib retracement level of the upward move from the $6,435 low to $7,486 high.
At the moment, the price seems to be trading in a range above the $7,000 support and below the $7,240 resistance. Additionally, there is likely a bullish continuation pattern forming resistance near $7,180 on the 4-hours chart of the BTC/USD pair.
Therefore, if there is an upside break above the $7,180 and $7,240 resistance levels, the price could start another bullish wave. An immediate resistance is near the $7,300 level, above which the price could rally towards $7,500 and $7,600.
Conversely, there could be a downside break below the $7,100 and $7,000 support levels. In the mentioned case, the price might test the $6,960 support area. It represents the 50% Fib retracement level of the upward move from the $6,435 low to $7,486 high.
The main support is near the $6,830 level, below which the price is likely to restart its downtrend and move back into a bearish zone. The next major supports are near $6,500 and $6,400.
Looking at the chart, bitcoin price is clearly trading in a positive zone above the $7,000 and $6,960 support levels. In the short term, there could be either range moves or a minor dip towards $6,960 before the price starts another increase.
Technical indicators
4 hours MACD – The MACD for BTC/USD is slowly losing bullish momentum.
4 hours RSI (Relative Strength Index) – The RSI for BTC/USD is still well above the 50 level.
Major Support Level – $6,960
Major Resistance Level – $7,240
The post Bitcoin Weekly Forecast: Is This Right Time To Buy BTC? appeared first on NewsBTC.
from NewsBTC https://www.newsbtc.com/2019/12/22/bitcoin-weekly-forecast-is-this-right-time-to-buy-btc/


0 Comments