- Ethereum is up more than 8% from the recent low of $115 against the US Dollar.
- The price is showing signs of a trend reversal, but it must surpass $135.
- Earlier, there was a break above a connecting bearish trend line with resistance near $122 on the hourly chart of ETH/USD (data feed via Kraken).
- Bitcoin rallied more than 10% and reversed most its losses from well above $7,000.
Ethereum price is moving into the positive zone versus the US Dollar, while bitcoin already reclaimed $7,000. ETH price is likely to grind higher towards $135, $140 and $144.
Ethereum Price Analysis
After a massive drop, Ethereum extended its decline below the $120 support against the US Dollar. ETH price tested the $115 zone and formed a new multi-month low.
However, the bulls took a strong stand near $115, resulting in a sharp pullback above $120. Moreover, bitcoin price jumped more than 10% and rallied above $7,000 (as warned in yesterday’s analysis – Bitcoin (BTC) Bears Remain in Driver’s Seat but Bulls Not Done Yet).
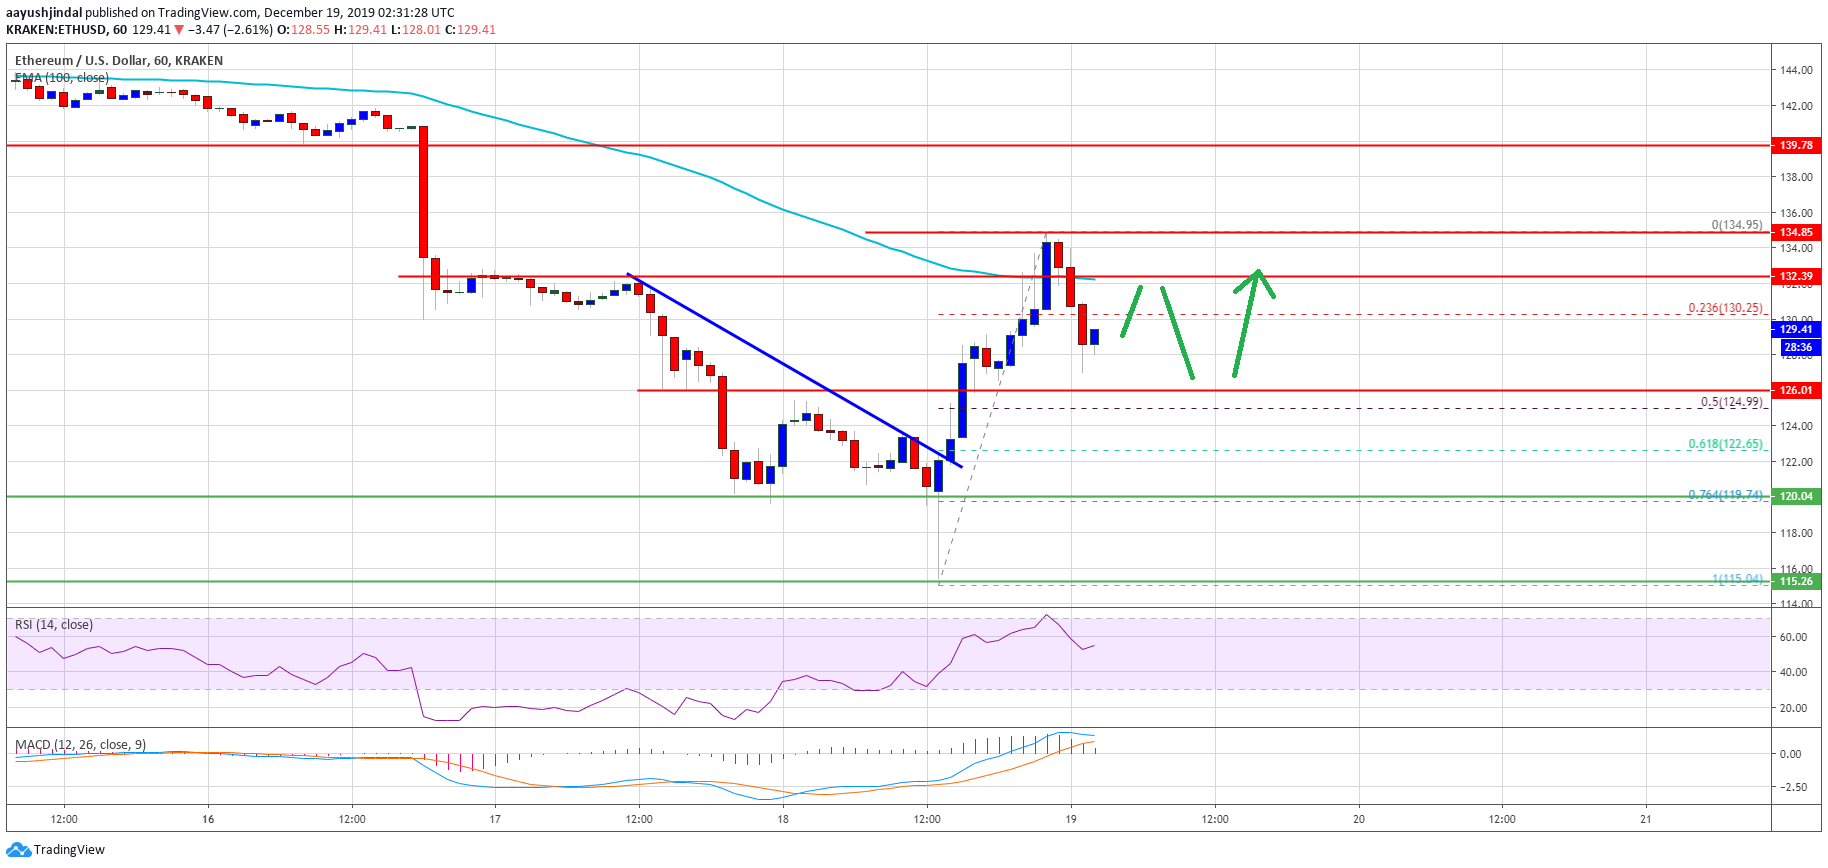
Ethereum price recovered nicely above the $120 and $125 resistance levels. Besides, there was a break above a connecting bearish trend line with resistance near $122 on the hourly chart of ETH/USD.
It opened the doors for more gains above the $130 resistance area. The price seems to be back in a positive zone, but it struggled to clear the $135 resistance and the 100 hourly simple moving average.
A swing high is formed near $135 and the price is currently correcting lower. It is trading below the 23.6% Fib retracement level of the recent rally from the $115 low to $135 high.
On the downside, there are key supports forming near the $126 and $125 levels. Additionally, the 50% Fib retracement level of the recent rally from the $115 low to $135 high is near the $125 level.
Therefore, Ethereum is likely to find buyers near the $125 zone. If there is a fresh decline below $125, the price could move back into a negative zone in the near term.
Conversely, the price might continue to rise above the $130 and $135 levels. The next target for the bulls could be $140 and $144.
Looking at the chart, Ethereum price is showing signs of an important reversal above $125. More importantly, bitcoin is already up 10% and now moving nicely above the $7,000 level.
ETH Technical Indicators
Hourly MACD – The MACD for ETH/USD is currently in the bullish zone.
Hourly RSI – The RSI for ETH/USD is back above the 50 level, with positive signs.
Major Support Level – $125
Major Resistance Level – $135
The post Ethereum (ETH) Reversal On Cards, Bitcoin Pump Warning Went Well appeared first on NewsBTC.
from NewsBTC https://www.newsbtc.com/2019/12/19/ethereum-eth-reversal-bitcoin-pump/


0 Comments