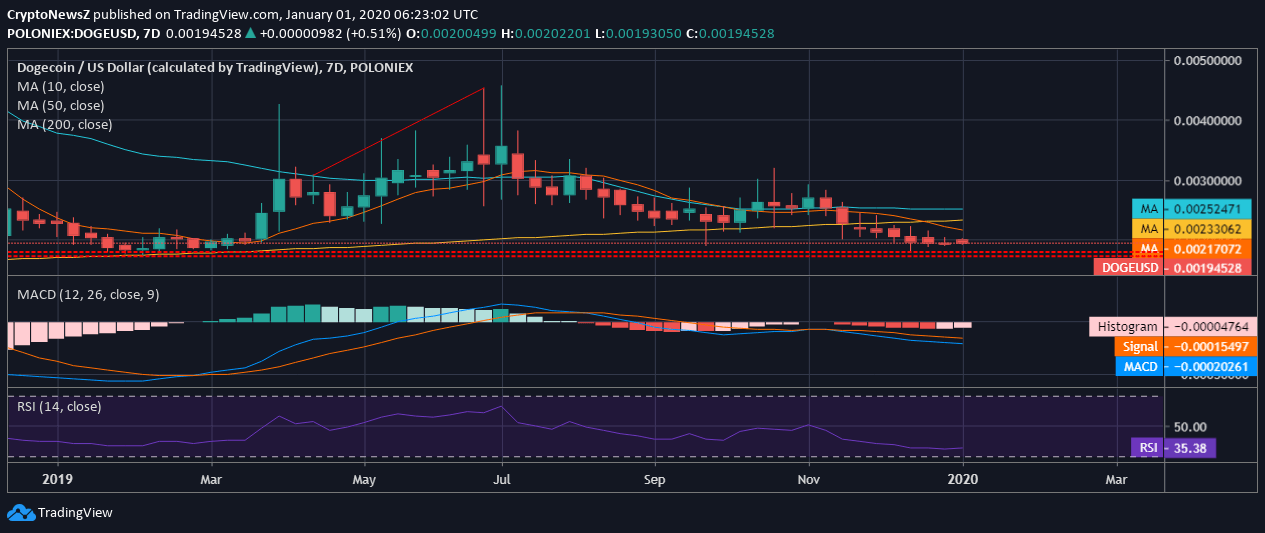
Dogecoin (DOGE), at the time of writing, was trading at $0.00194. The beginning of the new year has not been that impressive as Bitcoin price was seen consolidating around $7,200 after having corrected from $7,500. Moreover, Dogecoin, in the second half of the bygone year, was seen nosediving only.
The current trading price holds a risk of even more downside correction as the imminent supports lie at $0.0017 and $0.0018 price area. The current trading price also lacks support from the major moving averages.

Analyzing the 3-day movement of DOGE/USD on Poloniex, we see that the coin has given an Elliot Wave like movement in 2018. However, the previous year has been quite a disgrace, if looked upon cumulatively and comparatively. In the previous year, DOGE against USD soared as high $0.00447, and after that, it has only recorded a downtrend, lacking support and hitting bottom. The current trading price is over 57% less than the marked 52-week high. The immediate red candle formation confirms the bearishness and the selling pressure under which the coin is trading.
Alongside the technical indicators laid also confirm the lack of support as the 10-day, 50-day, and 200-day moving average are moving away from the current price trend.
The MACD of Dogecoin is running below zero and holds a bearish crossover as the signal line overrides the MACD line.
The RSI of the coin is at 35.38 and is inclined towards the oversold region but holds no extremities at present.


0 Comments