


The Ethereum price began a rapid decrease once it reached a high of $278.26 on Feb. 24. Three days later, it reached a significant support line and bounced upward, making an attempt to reverse the trend.
Ethereum (ETH) Price Highlights
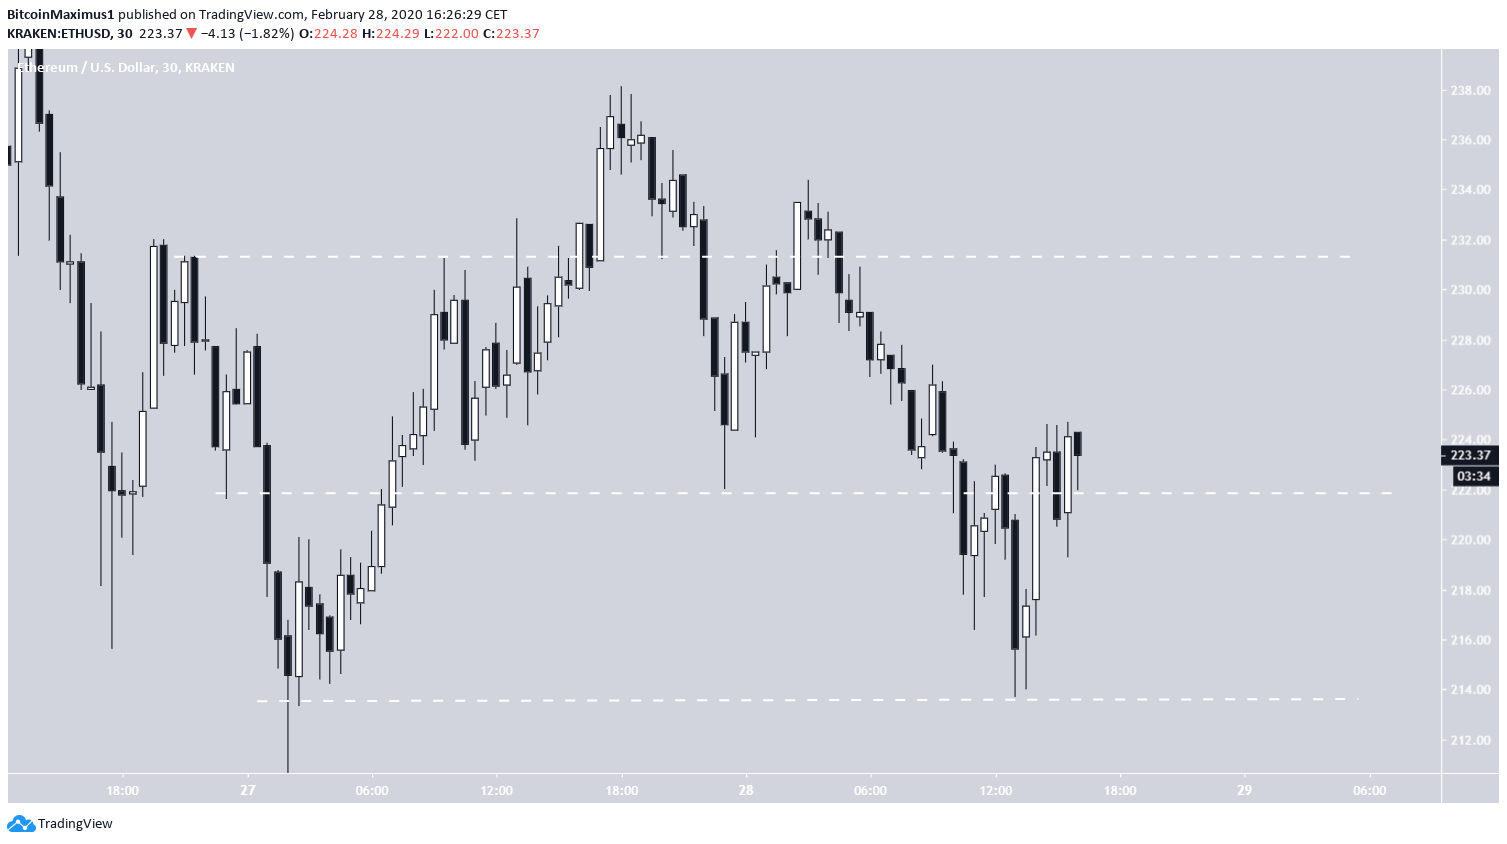
- The price is trading in a short-term range between $213-$231.
- The price is following an ascending support line.
- A golden cross has transpired.
- The price has created a double bottom.
- There is resistance at $248.
Cryptocurrency trader @george1trader tweeted an Ethereum chart that shows the price moving above the mid-point of a trading range that he has outlined. He believes the price will soon reach the range high at $232.
Clean retest of range low. Upside liquidity is next as long as blue holds imo. pic.twitter.com/6FVv3Ekkre
— George (@George1Trader) February 28, 2020
Let’s take a closer look at the Ethereum price movement and determine where it is heading to next.
Note: This analysis will deal with the ETH/USD pair. For an ETH/BTC analysis, click here.
Trading Range
The Ethereum price has been trading in a range between $213-$231 over the past two days. While it briefly moved above this level on Feb. 27, it immediately decreased inside it.
The decrease continued until the price validated the bottom of the range once more, then the trend reversed and ETH has been moving upward since, going above the middle of the range.
In order to determine the future movement, a look at a higher time-frame is required.
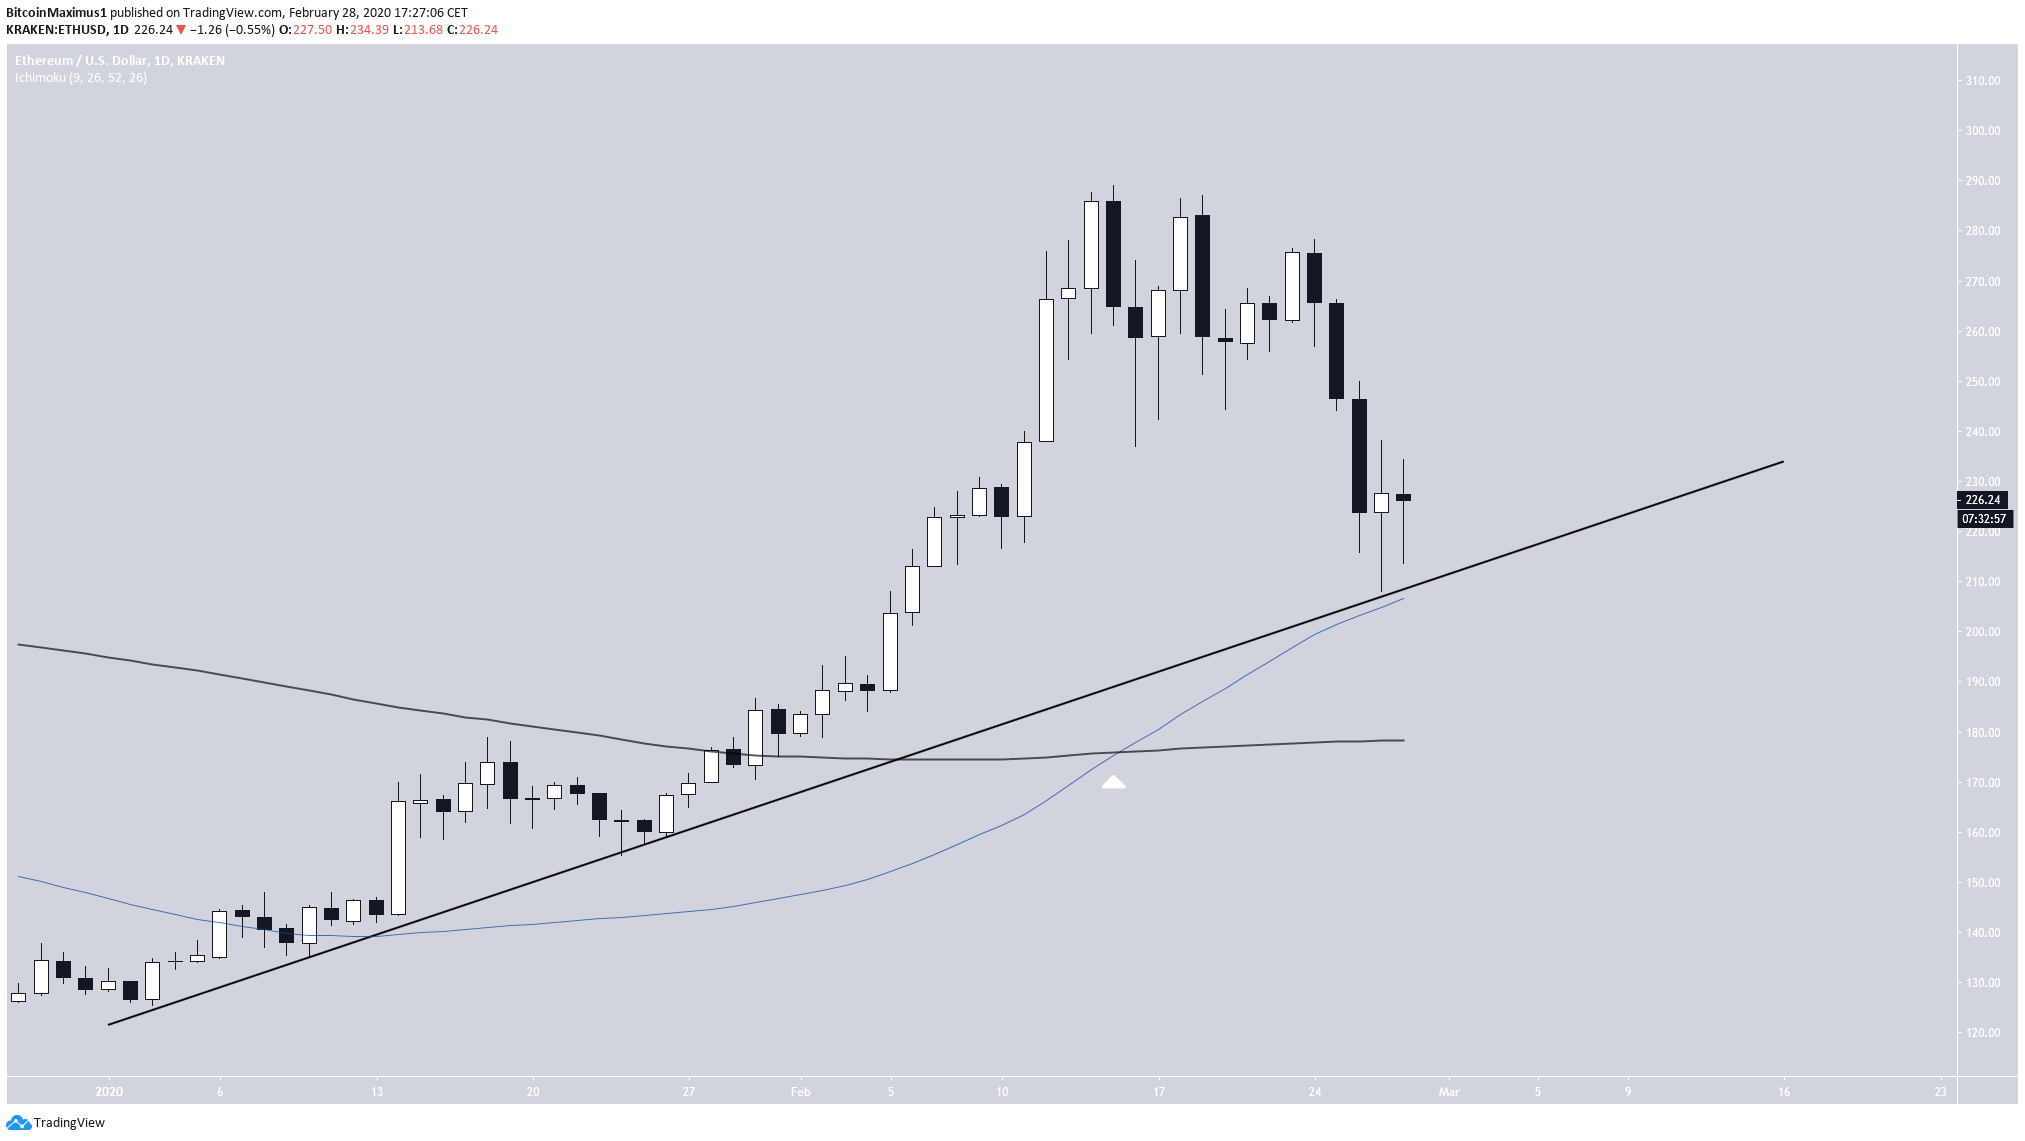
Ascending Support Line
The Ethereum price has been following an ascending support line since Jan. 2, 2020. The recent decrease served to validate the support line for the fourth time, and the price created a long lower wick and moved upward. The decrease also validated the 50-day moving average (MA).
Besides this support line that suggests the price will increase, a bullish cross between the 50- and 200-day MAs transpired on Feb. 16.
So, the price is expected to move toward the top of the short-term range discussed in the previous section.
Double Bottom
Going back to the short-term movement, we can see that the price has created a double bottom, combined with long lower wicks. Even more, this bullish reversal pattern has been combined with bullish divergence in the RSI.
Therefore, the price is expected to increase and eventually reach the resistance area at $248, which was the previous breakdown level.
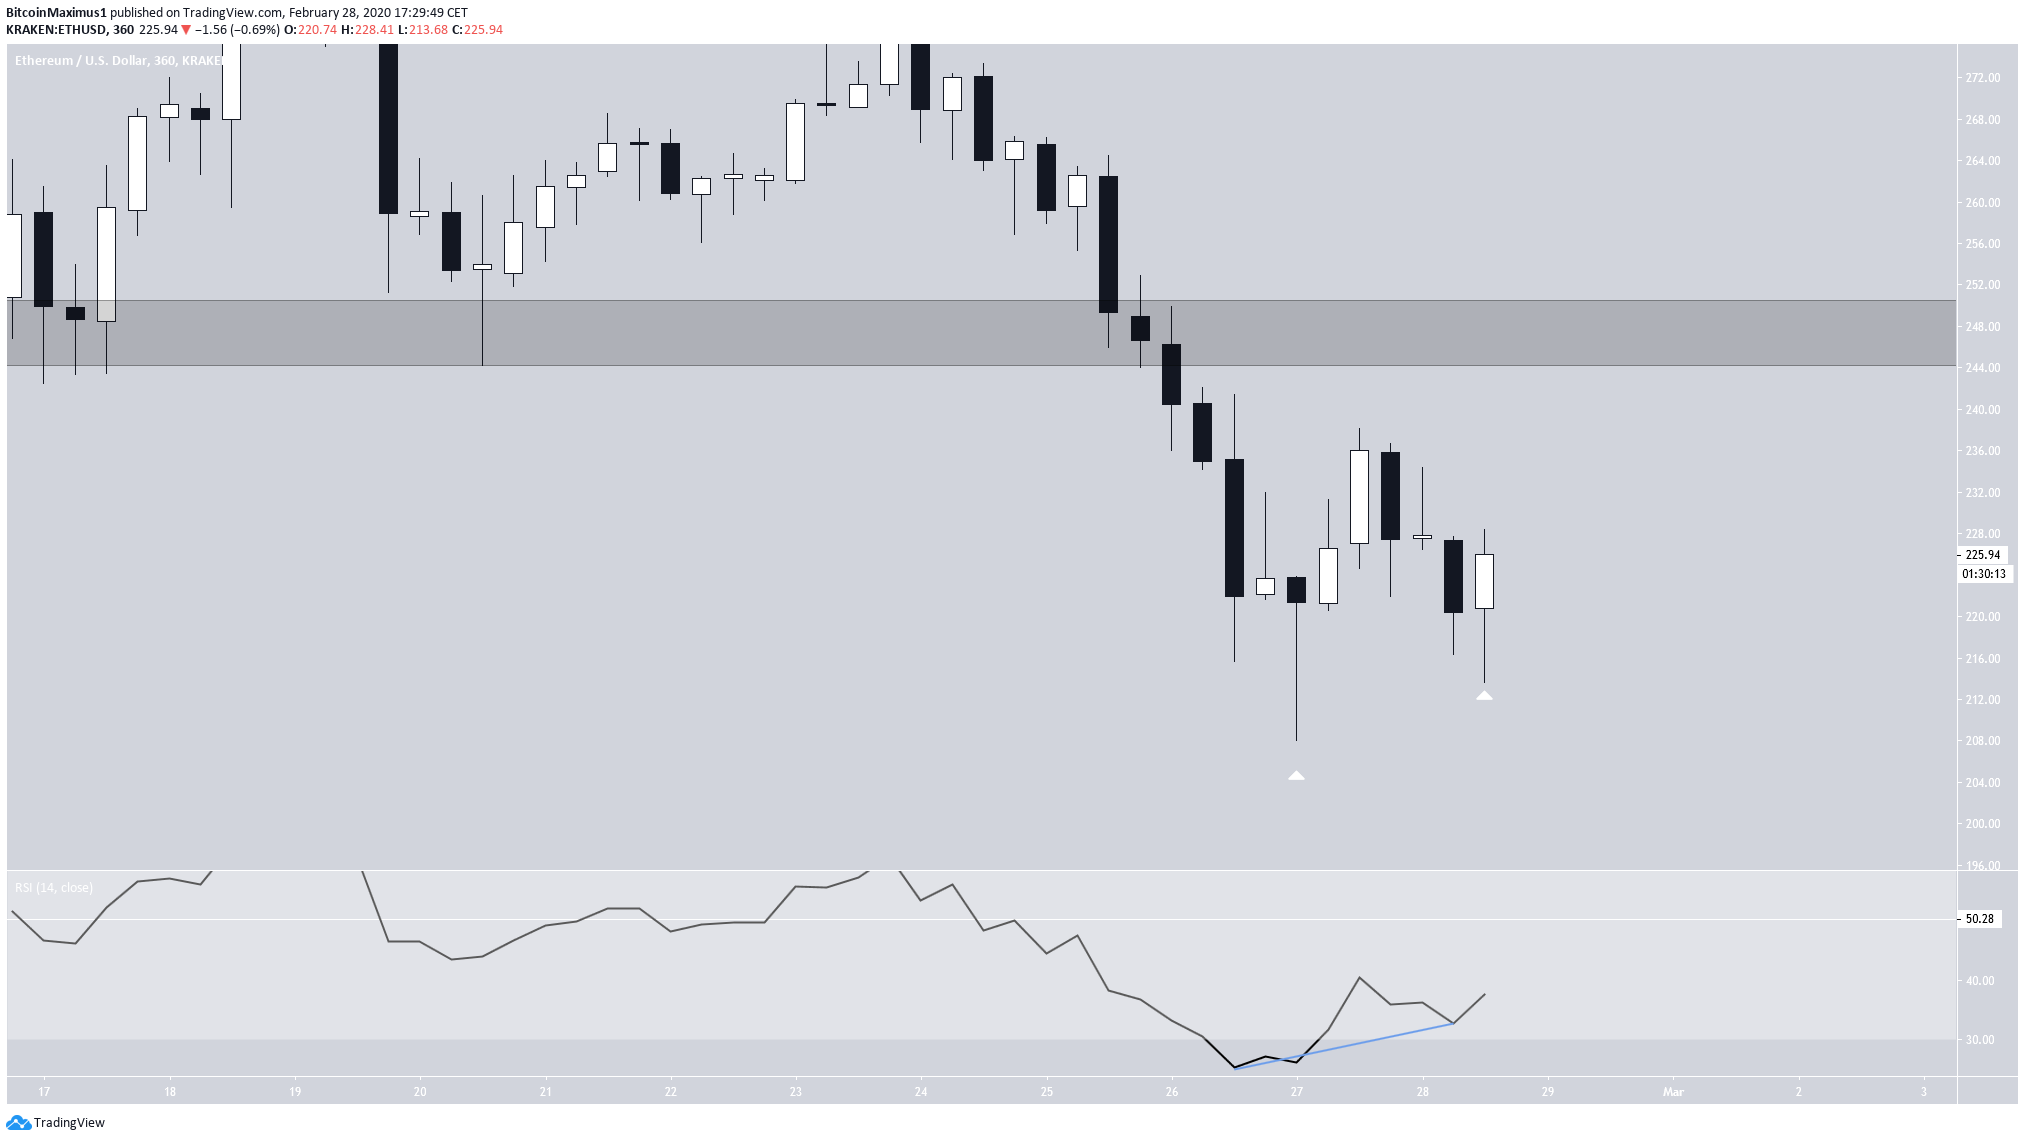
To conclude, the Ethereum price has completed a double bottom and is expected to move upward toward the next resistance area at $248.
The post Can an Ethereum Increase Pave the Way for Altcoins? appeared first on BeInCrypto.
from BeInCrypto https://beincrypto.com/can-an-ethereum-increase-pave-the-way-for-altcoins/


0 Comments