


On February 2, the VET price broke out from a descending wedge and has been increasing since.
Vechain (VET) Highlights
- VET broke out from a descending wedge.
- There is strong resistance at 105 satoshis.
- The VET price is possibly in the third wave of a five-wave Elliott formation.
- The RSI is bullish in almost every time-frame.
Full-time trader @CryptoMichNL outlined a VET chart that shows the price moving towards his target of 84 satoshis. After a period of ranging, he believes VET will reach 100, or even 160 satoshis.
And we're approaching T1, finally.
Beautiful flips of the 64 and 72 satoshis levels and now continuing.
Ranging here for a bit and we might continue to 100 or even 160 satoshis. https://t.co/2n4AoFDZkU pic.twitter.com/vzEkVFiOWt
— Crypto Michaël (@CryptoMichNL) February 13, 2020
Let’s take a closer look at the VET price movement and determine if it will be successful in reaching the outlined target.
VET Wedge Breakout
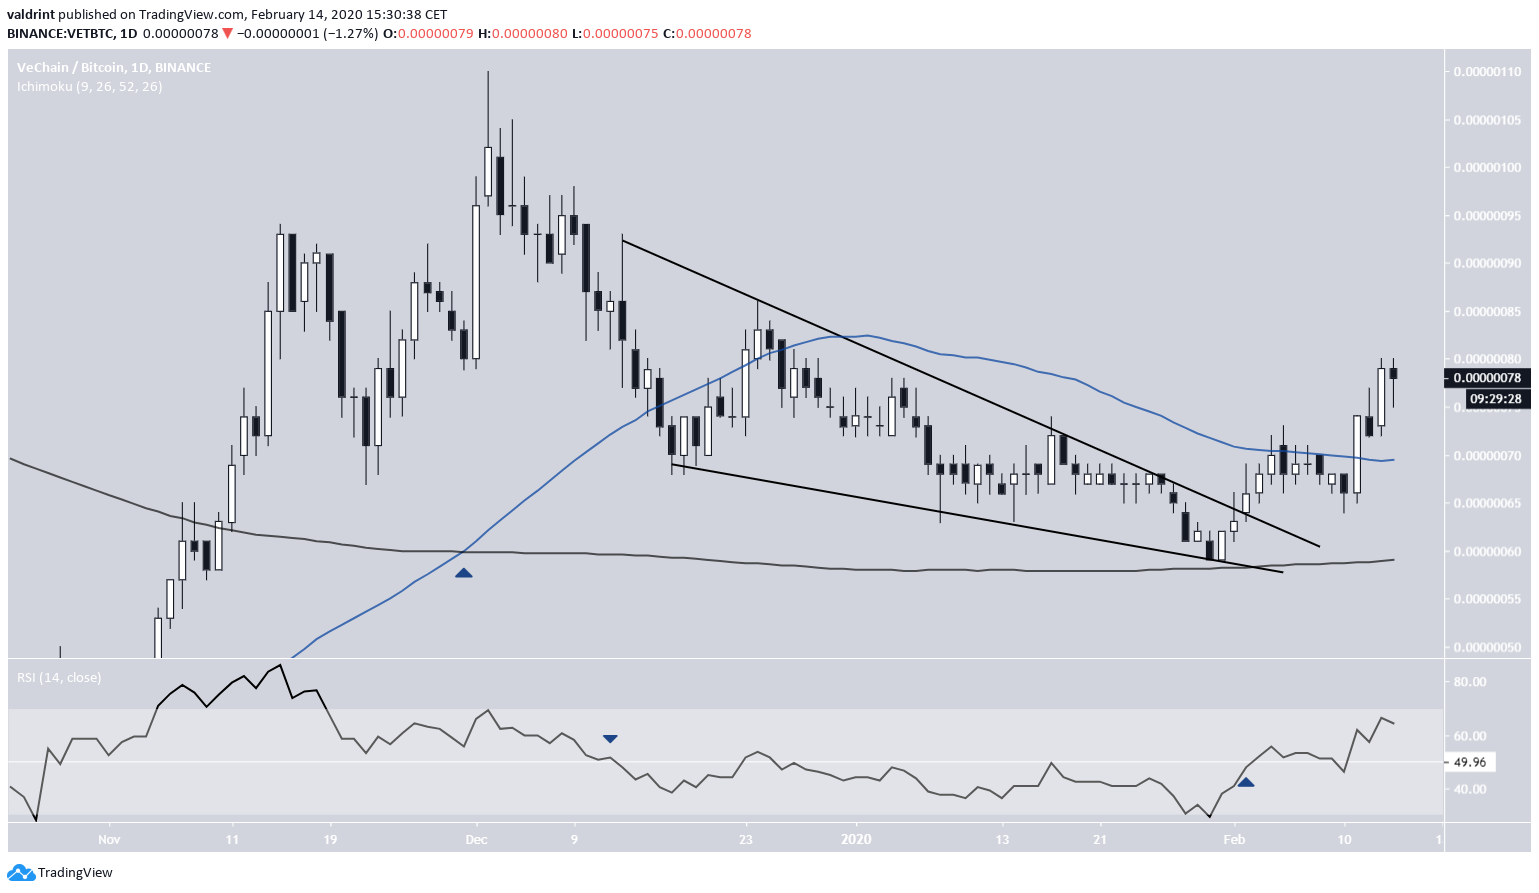
The VET price broke out from a descending wedge on February 2.
The 50- and 200-day moving averages (MA) have previously made a bullish cross, and the price is trading above them. Since the cross has occurred some time prior, on November 30, 2019, it is possible that the upward move began earlier, and the decrease in the form of the wedge was part of the correction.
After the breakout, the daily RSI again moved above 50. It had been below this line since the creation of the descending wedge.
Elliott Formation
The weekly chart shows that the most important resistance area is found at 105 satoshis, which was the previous breakdown level and rejected the price in December 2019. A price movement above it would remove all doubt that VET has begun an upward trend.
The weekly RSI movement is quite bullish. It moved above the 50-line in November 2019, right around the time that the golden cross transpired. After staying right at the line until February, it bounced strongly during the previously mentioned breakout from the wedge. 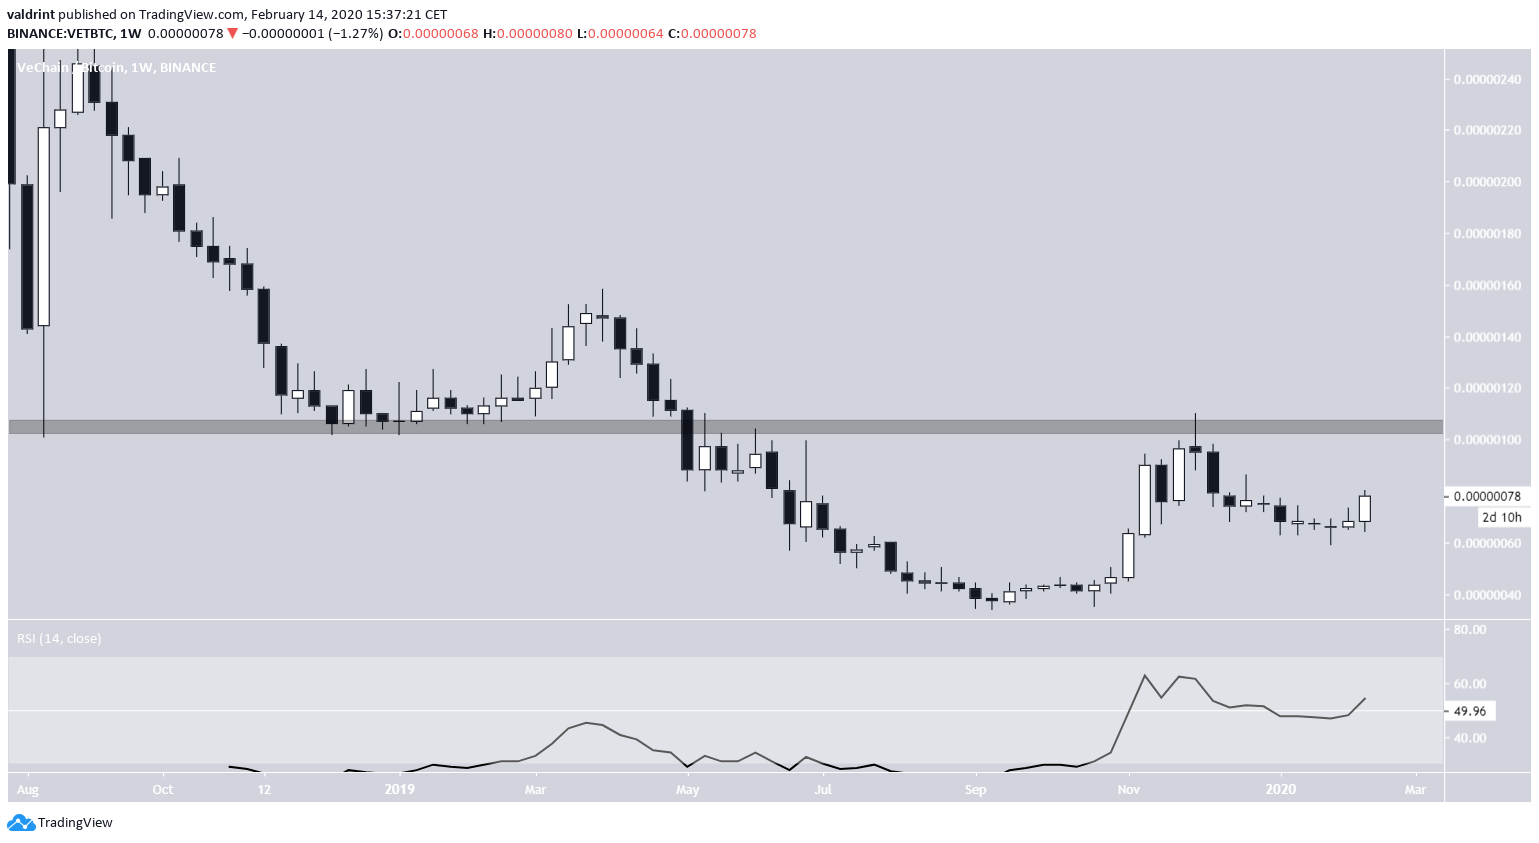
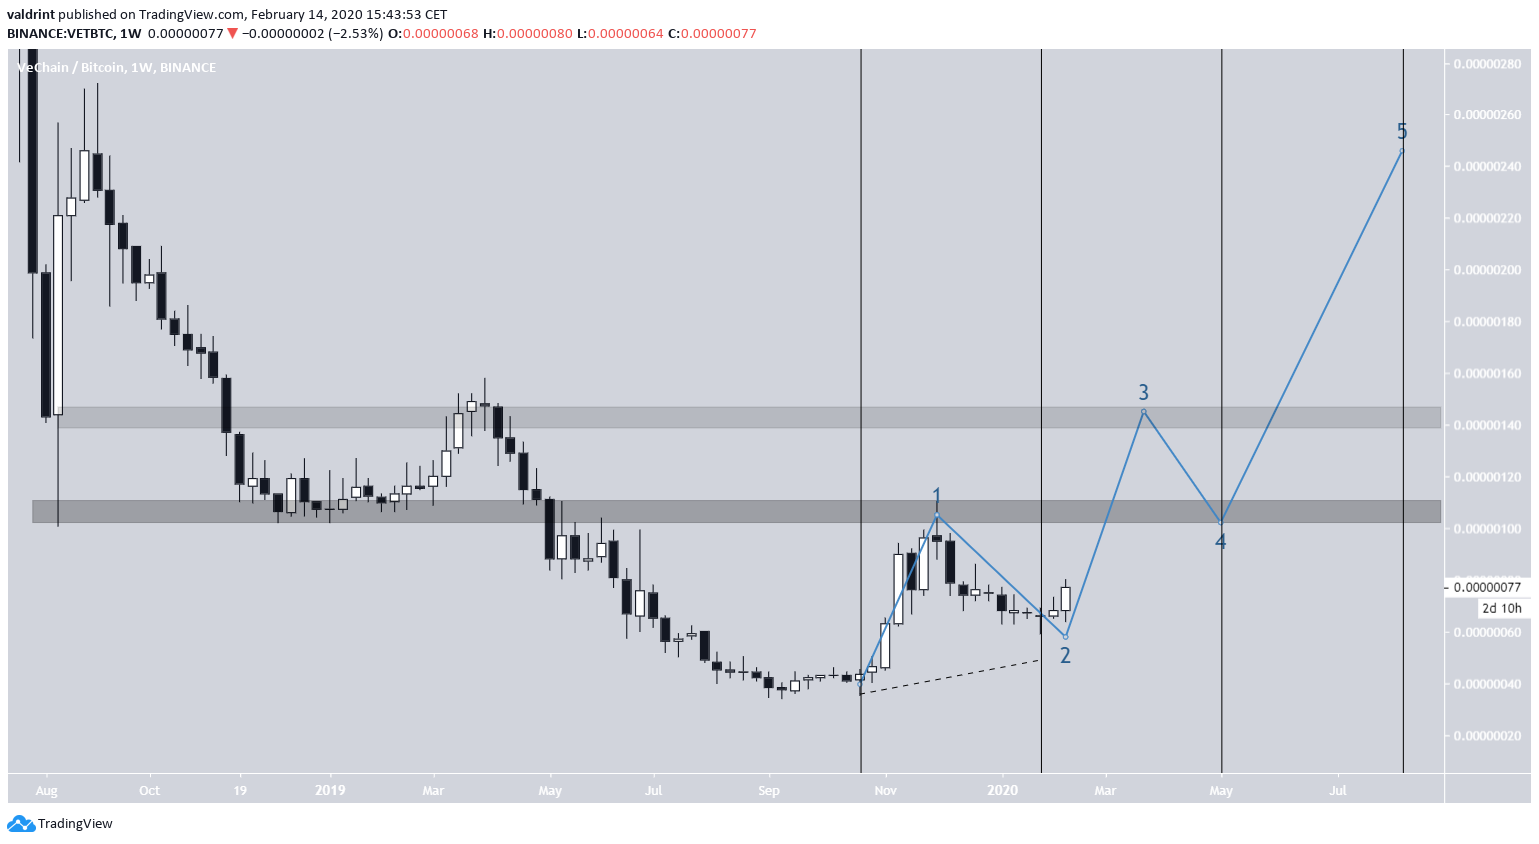
This makes us believe that the entire upward move from November-December 2019 was the first wave out of a five-wave Elliott formation. The descending wedge was the second wave, which is corrective, while the breakout marked the beginning of the third wave.
Based on the closest resistance areas and the length of the retracement, the third wave could go as high as 145 satoshis.
For the longer-term, a target for the high of the fifth wave is given at 245 satoshis. Judging by the length of the first two eaves, could be reached by August 2020.
The targets for the tops of the third and fifth waves respectively are somewhat speculative, since the price is a long way from reaching them. However, they can serve as a good outline in case the price resumes the movement as traced.
 To conclude, the VET price has broken out from a descending wedge. This could have been the beginning of the third wave of a five-wave Elliot formation that could end near 145 satoshis. A longer-term target is given at 245 satoshis, expected to be reached in August.
The post Can VET Increase All the Way to 245 Satoshis? appeared first on BeInCrypto.
from BeInCrypto https://beincrypto.com/can-vet-increase-all-the-way-to-245-satoshis/


0 Comments