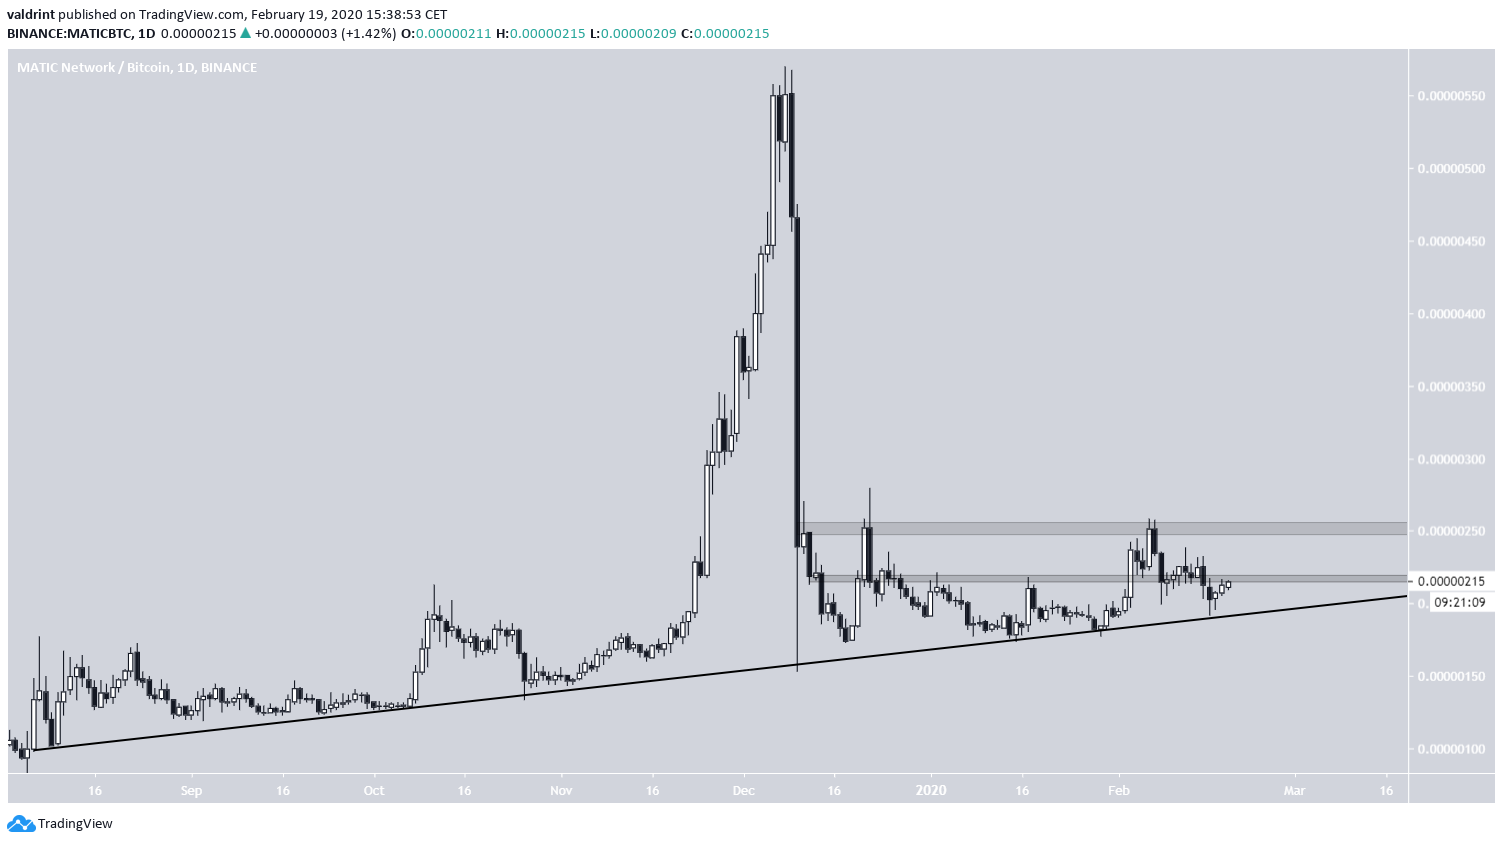
The Matic Network (MATIC) price has been decreasing since February 7. On February 16, it reached the long-term ascending support line and began an upward move that is still ongoing.
Matic Network (MATIC) Highlights
- The MATIC price is following an ascending support line.
- There is resistance at 220 and 250 satoshis.
- Technical indicators are bullish.
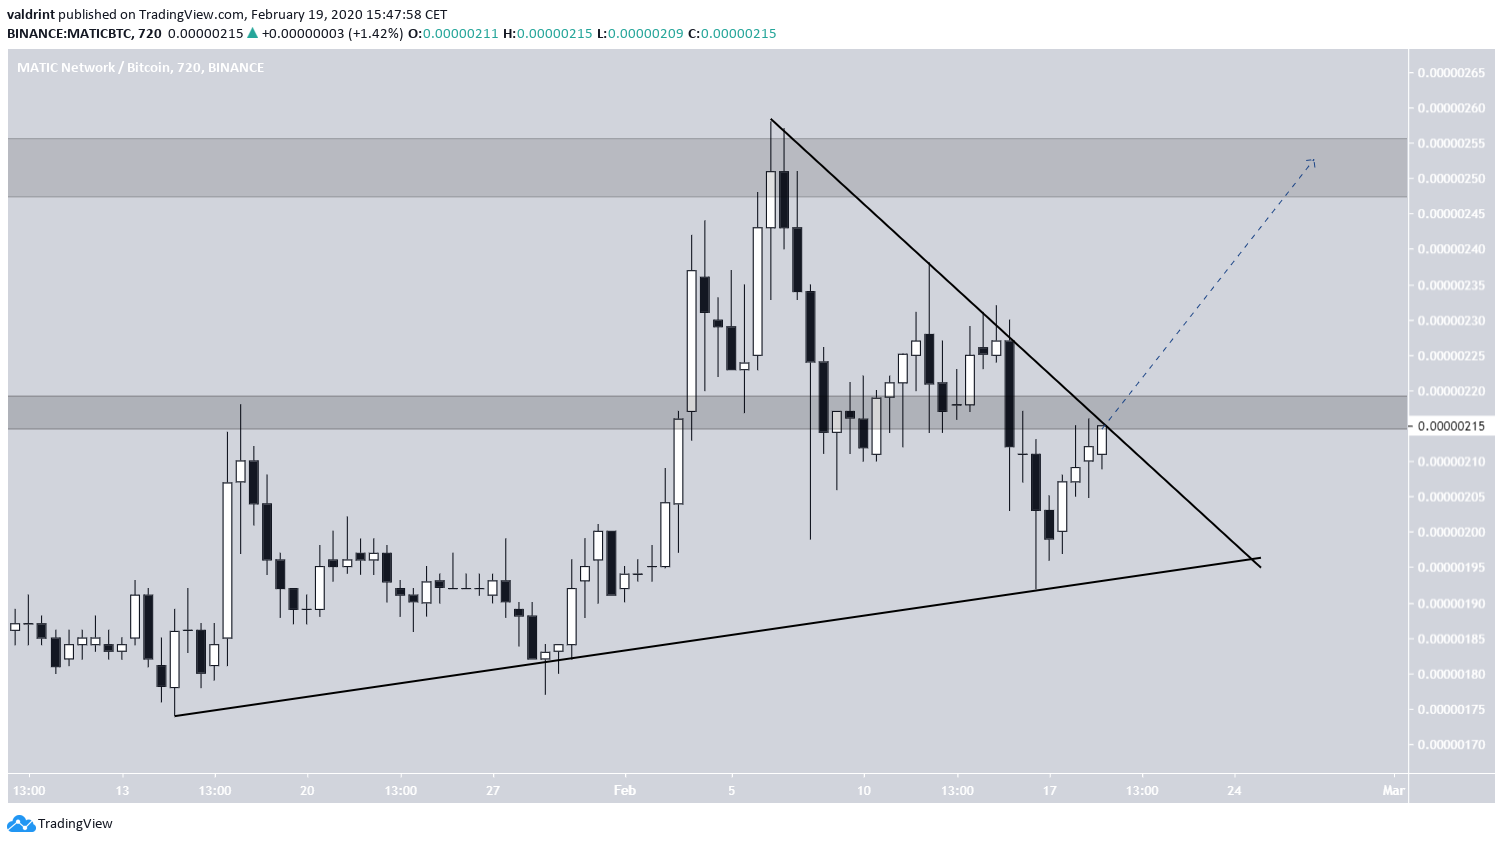
- MATIC is trading inside a symmetrical triangle.
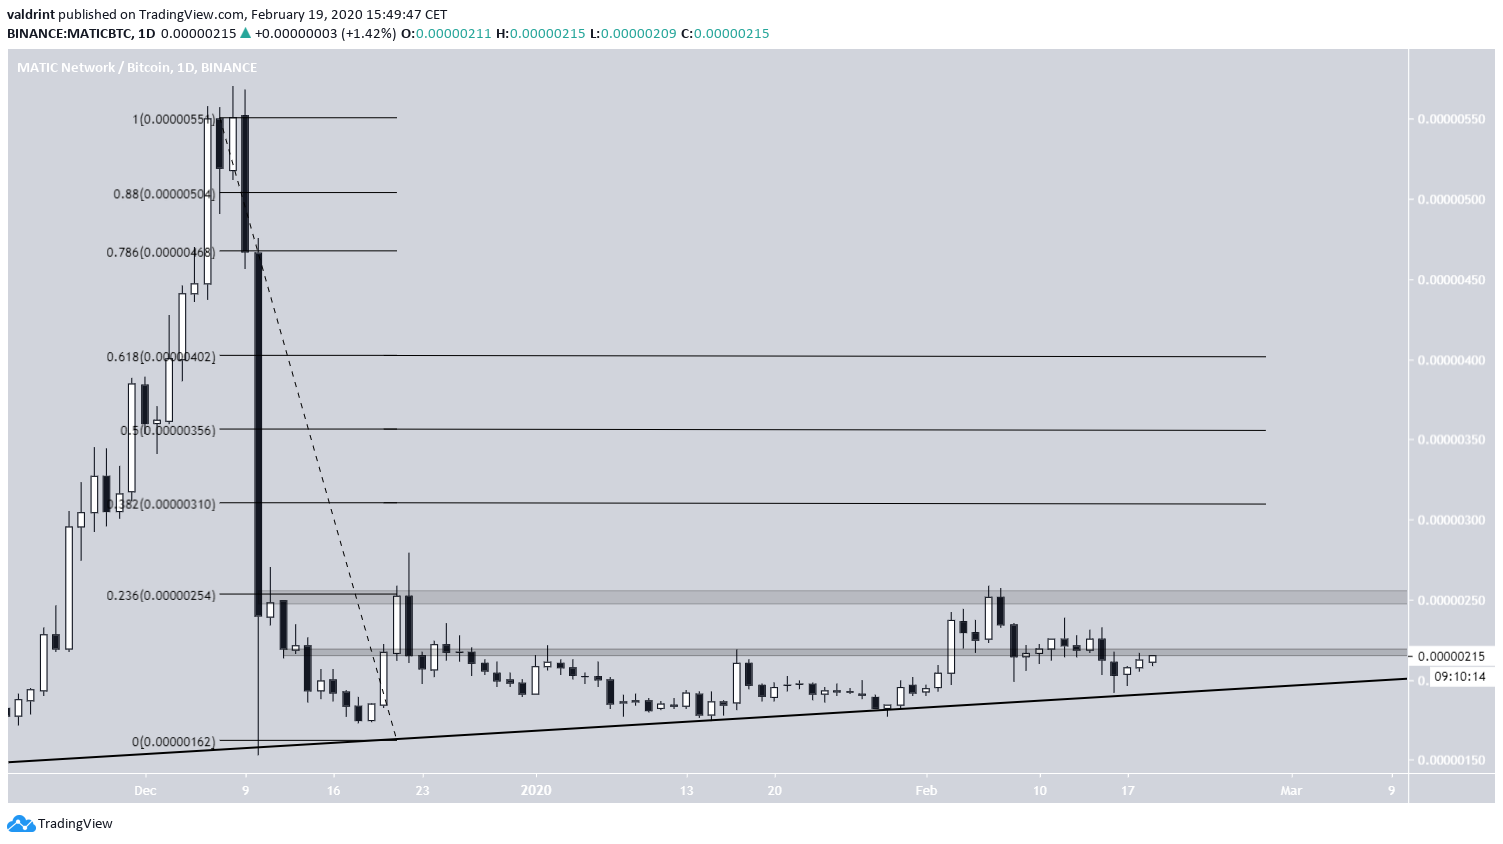
- Long-term targets are at 310, 356, and 402 satoshis.
Trader @pierre_crypt0 tweeted a MATIC chart which shows that the price is consolidating between a major resistance area and an ascending support line. If the price breaks out above this resistance, he believes MATIC will “moon.”
On the other hand, a breakdown below the ascending support line would likely take the price to new lows.
$MATIC #MaticNetwork – 1D
Holding 200d EMA so far, I haven't a position as big as I had a few days ago as I got stopped out on Sunday's wick, but still holding a position and staying patient.
Nothing has changed:
– Invalidated below major trendline.
– Moon above 250 sats. pic.twitter.com/FKSjqXSGCc
— Pierre
(@pierre_crypt0) February 18, 2020
Let’s take a closer look at the MATIC price alongside technical indicators and determine which is more likely.
Ascending Support Line
The MATIC price has been following an ascending support line since August 9, 2019. The line has been validated numerous times. Its significance is increased since even after the rapid decrease of December 10, in which the price decreased by almost 70 percent in a day, the price returned to validate this line.
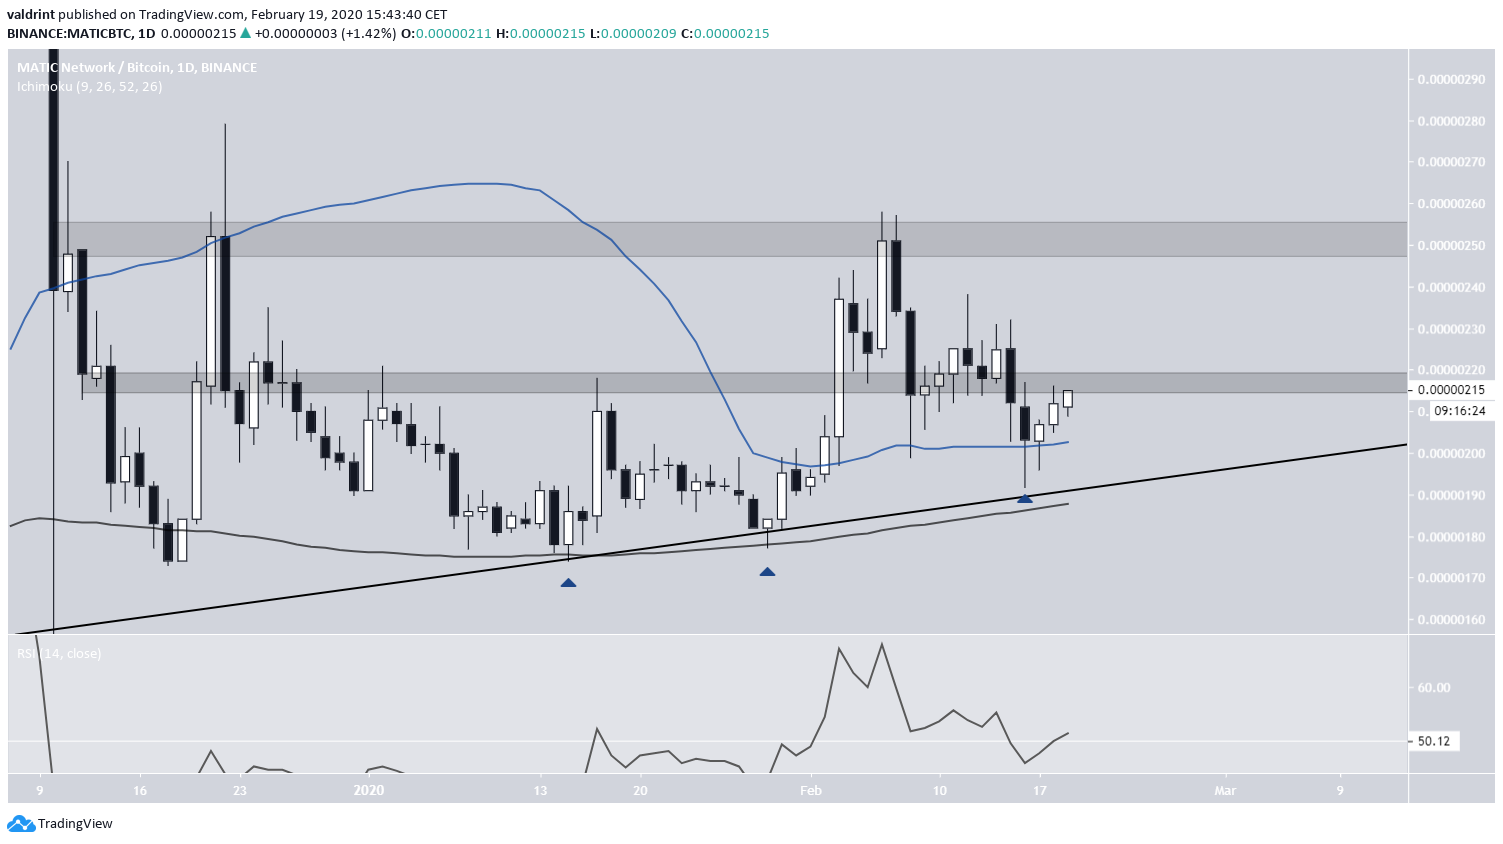
Since then, the price has been trading inside a range of 170-250 satoshis, with the lower limit of the range moving upwards along the ascending support line. In addition, there is a minor resistance area at 220 satoshis from which the price is currently struggling to break out.

Technical Indicators
The Matic Network price is trading above both the 50- and 200-day moving averages (MAs). The price has bounced thrice on the latter, the final time causing it to also move above the 50-day MA.
In addition, the RSI is in the process of moving above the 50-line. This makes a movement towards 250 satoshis the most likely scenario.
In both cases, MATIC looks relatively easy to trade either way, since the placement of a stop loss below both the ascending support line and the 200-day MA at 185 sats would prevent major losses and it is very unlikely that the price decreases below this level and then reverses.

Future Matic Price Movement
The MATIC price is also trading inside a short-term symmetrical triangle currently being right at the resistance line of this triangle. A breakout from this pattern would likely take the price inside the 250 satoshi resistance area.

In the long-term, we can use a Fib retracement tool from the December 9 high in order to find targets if the MATIC price breaks out above 250 satoshis and ”moons,” as stated in the tweet. The targets are found at the 0.618, 0.5, and 0.382 Fib levels and are at 310, 356, and 402 satoshis, respectively.

To conclude, the MATIC price has been consolidating since the rapid decrease of December 10. We believe it will soon move towards the resistance area at 250 satoshis and possibly break out towards the targets outlined.
The post Matic Network Looks Poised for Another Meteoric Rally appeared first on BeInCrypto.
from BeInCrypto https://beincrypto.com/matic-poised-another-meteoric-rally/


0 Comments