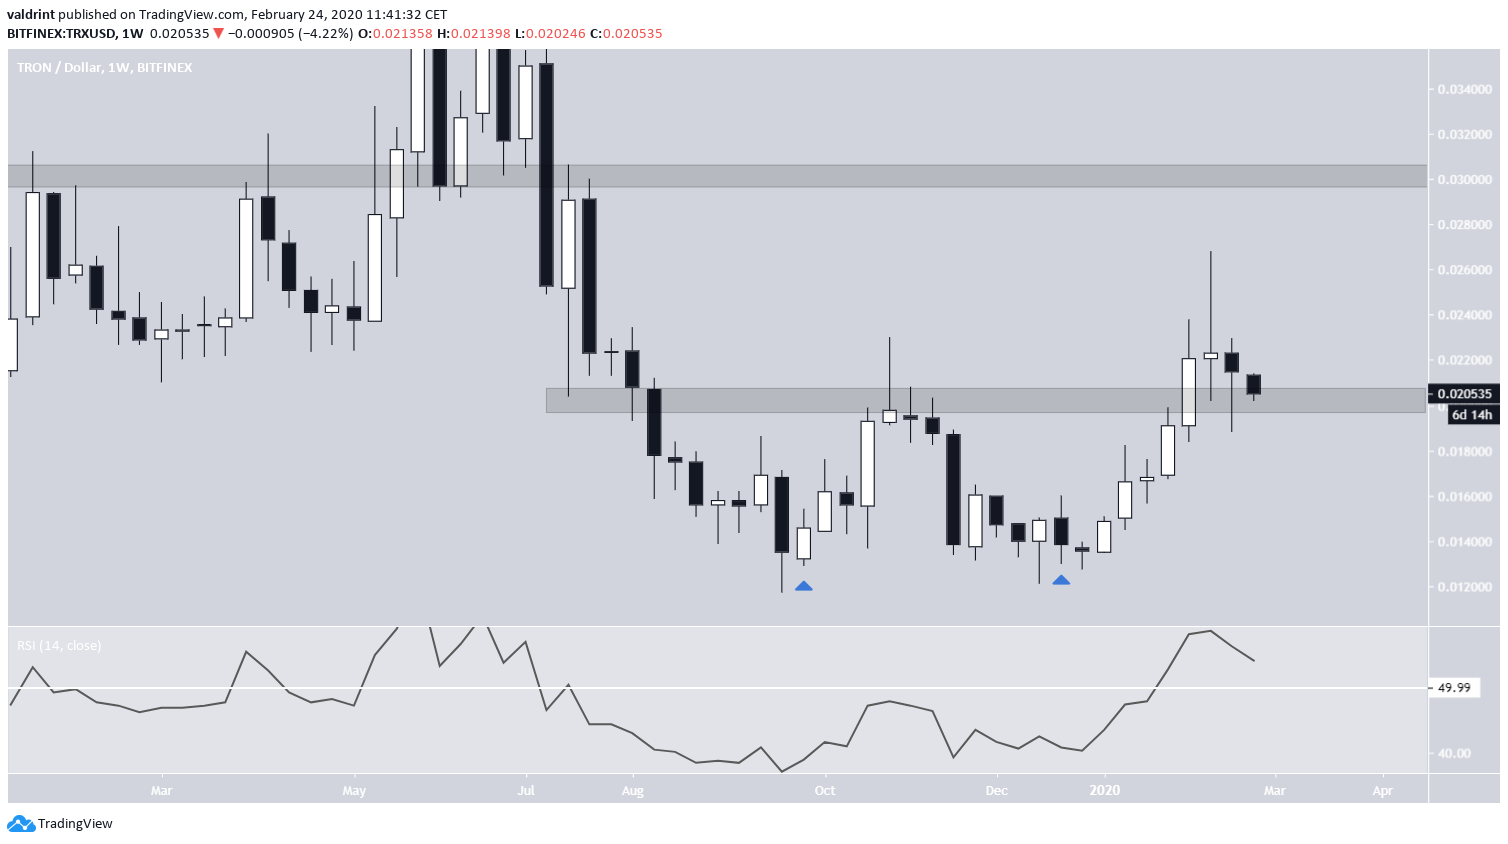
The TRX price has successfully completed a double bottom, which is considered a bullish reversal pattern. As long as it stays above the $0.02 area which is now acting as support, we are expecting the price to continue moving upwards.
Tron (TRX) Price Highlights
- TRX/USD
- Has successfully completed a double bottom.
- There is support & resistance at $0.02 and $0.03.
- The weekly RSI is bullish.
- The price is following an ascending support line
- TRX/BTC
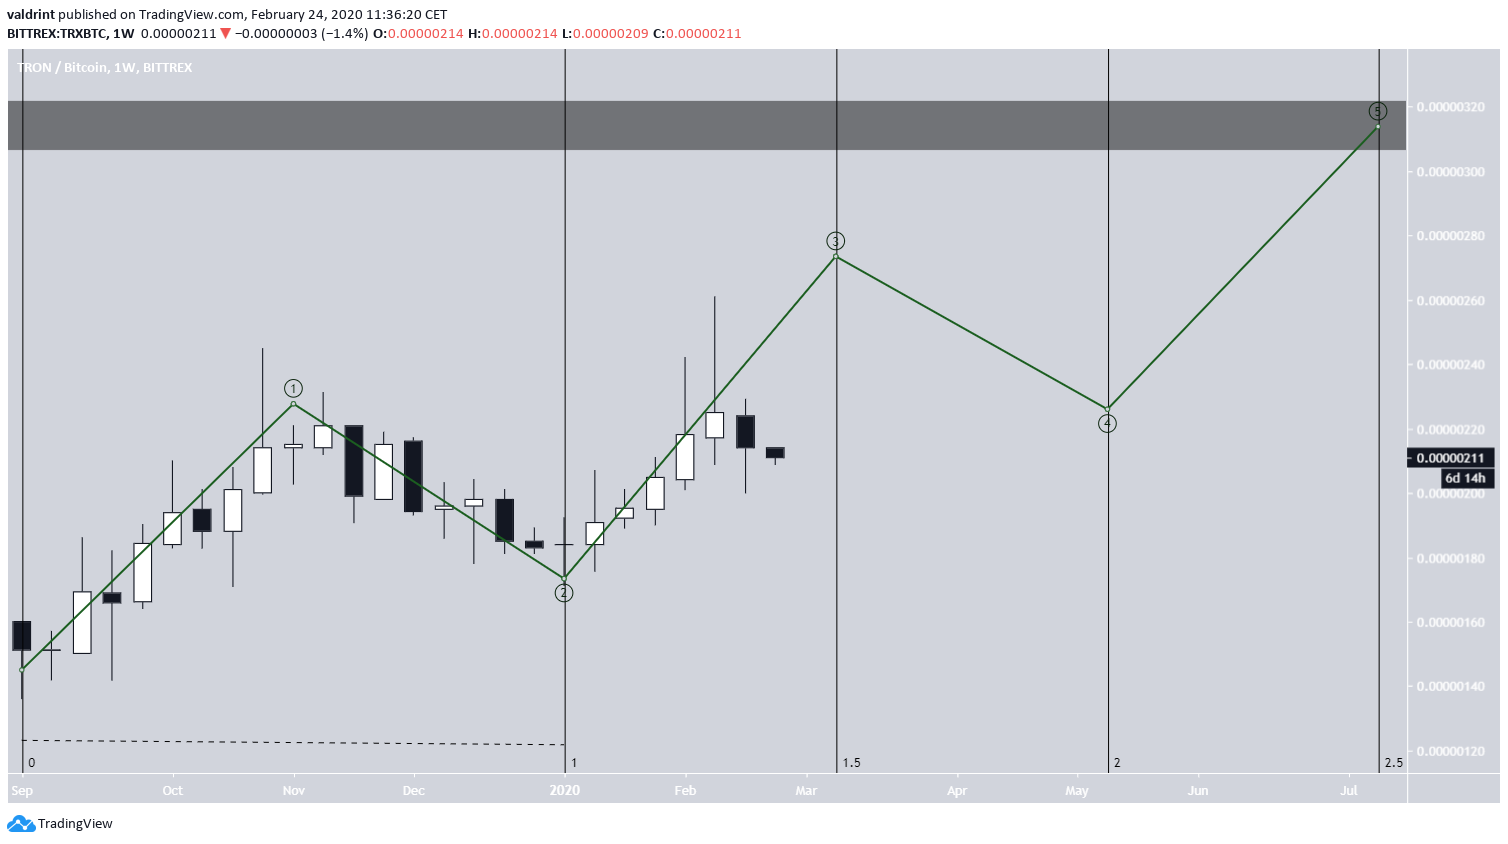
- Is likely in the third wave of a five-wave Elliott formation.
- It is in the fifth subwave of the longer-term third wave.
Cryptocurrency investor and trader @George1Trader tweeted a TRX chart stating that he believes it is almost time to buy this coin.
Almost time to buy some shitcoin tron? pic.twitter.com/LKPHOYUCUp
— George (@George1Trader) February 21, 2020
Let’s take a closer look at the TRX price chart and determine if it is actually a good time to buy TRX.
TRX/USD
In the period from September-December 2019, the price completed a double bottom near $0.0125, with the high between them being at $0.02. Afterward, the price increased above the $0.02 area and is now in the process of validating it as support.
The weekly RSI is bullish since it has increased above 50.
The next resistance area is found at $0.030. As long as the price stays above $0.02, we expect the price to continue moving towards its target.

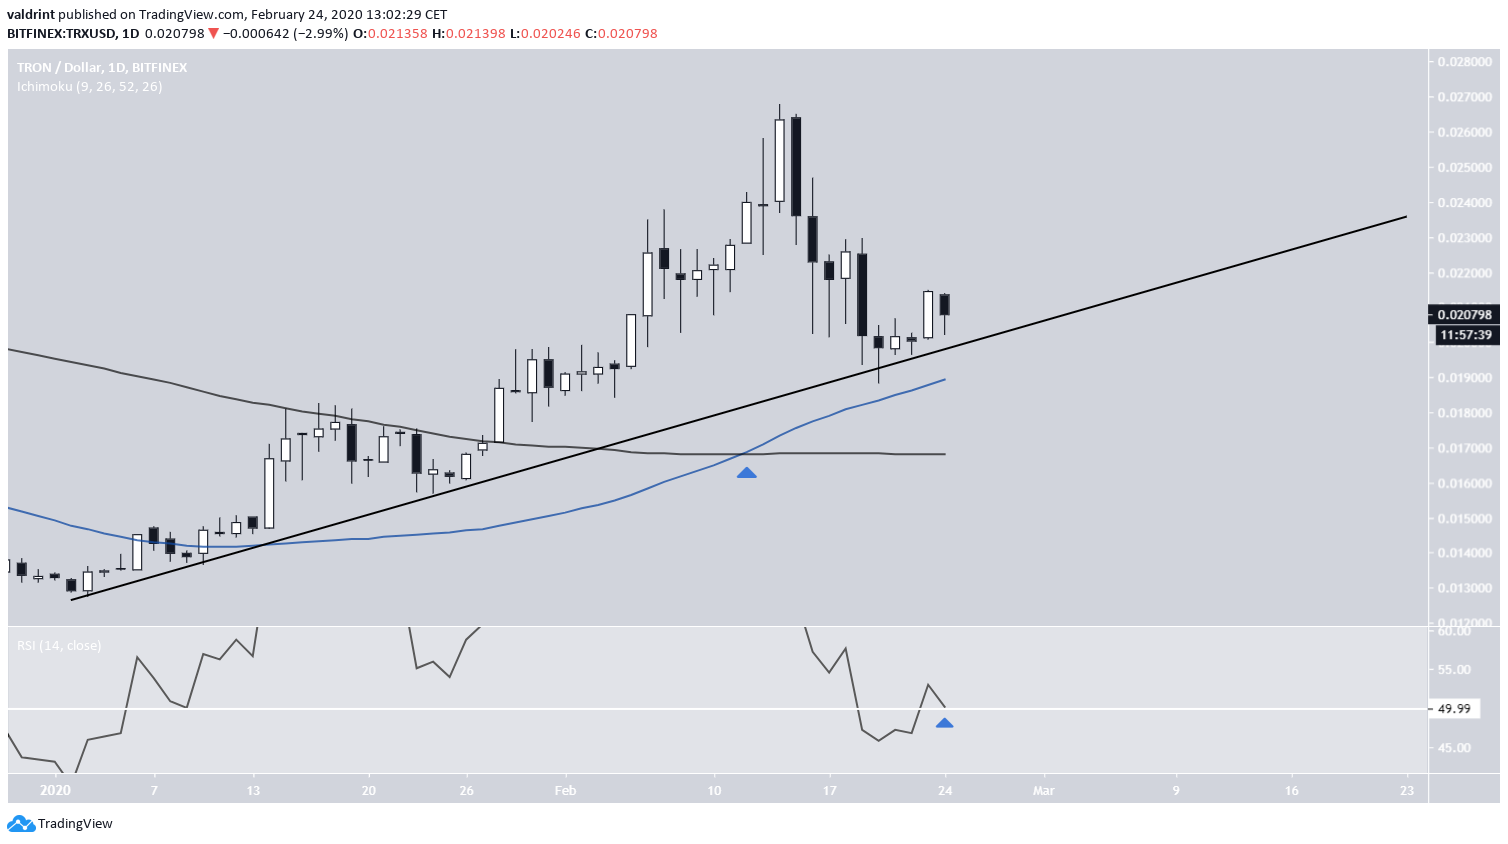
The price has been following an ascending support line since January 2.
In addition, a bullish cross has transpired between the 50- and 200-day moving averages (MA), both of which are giving support to the current price.
Finally, the daily RSI has also moved above 50. All these bullish signs make us think that the TRX price will increase and eventually reach $0.03. The lack of a resistance line makes it unable to predict when the price will do so.

TRX/BTC
In our previous analysis, we have outlined a possible five-wave Elliott formation for TRX. Since we are likely in the third wave, which is projected to end near 270 satoshis in the middle of March, let’s try to analyze each sub-wave on its own for a more accurate prediction.

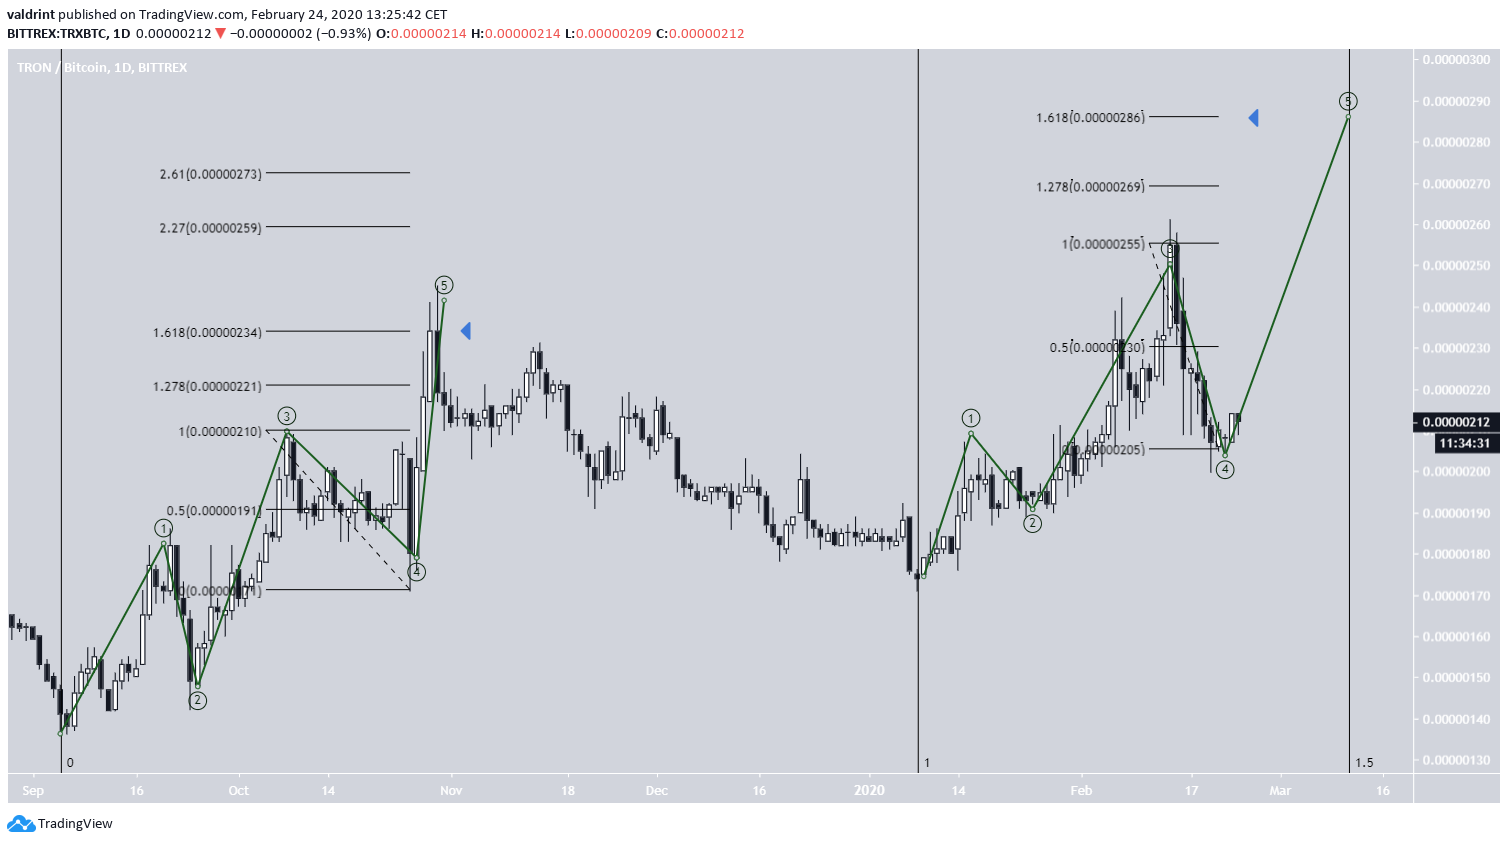
The most likely scenario is that TRX has just completed the fourth sub-wave at 210 satoshis, which also was the high of the first sub-wave.
While the wavelength and duration is slightly irregular, it is extremely similar to the five sub-waves of the first longer-term wave that was completed in September-November 2019.
Using the same Fib ratios, we can presume that the fifth sub-wave will be completed at the 1.618 Fib level of the previous decrease at 285 satoshis around March 11.
Since we believe that the BTC price will be around $10,000, we can use this to make the prediction that the $0.03 area will be reached around the same time.

To conclude the TRX chart shows that the price has completed a bullish reversal pattern and is ready to move upwards. The target for the top of the ensuing upward move is at $0.3 & 285 satoshis, expected to be reached by the middle of March.
The post TRX’s Bullish Reversal Pattern Reaffirms the Bullish Trend appeared first on BeInCrypto.
from BeInCrypto https://beincrypto.com/trxs-bullish-reversal-pattern-reaffirms-bullish-trend/


0 Comments