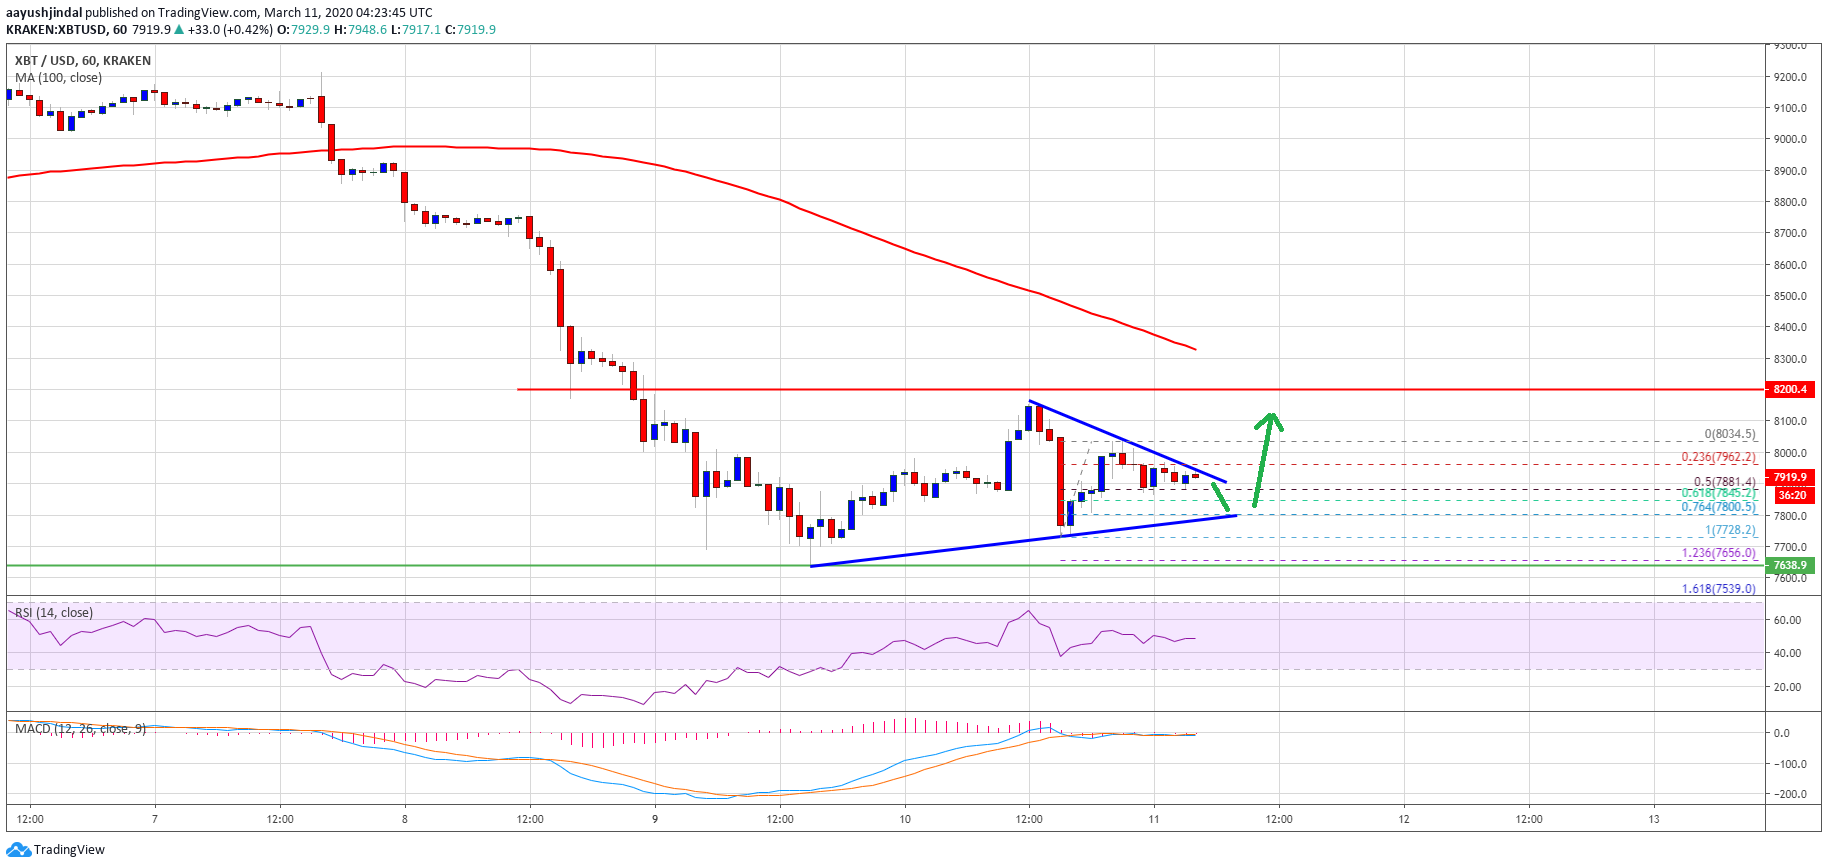
Bitcoin is facing a crucial resistance near $8,200 against the US Dollar (as discussed yesterday). BTC price could trade in a range for a few sessions before the next move.
- Bitcoin is trading in a bearish zone below the $8,200 resistance area against the US Dollar.
- The bulls are putting up a fight to defend the $7,800 and $7,700 support levels.
- There is a key contracting triangle forming with resistance near $7,950 on the hourly chart of the BTC/USD pair (data feed from Kraken).
- The pair could make another attempt to surpass the main $8,200 resistance area in the near term.
Bitcoin is Facing Hurdles
Yesterday, we discussed the chances of a short term recovery in bitcoin towards the $8,200 resistance area against the US Dollar. BTC price did start an upward move above the $8,000 and $8,100 levels.
However, the price failed to gain strength above the $8,180 and $8,200 resistance levels. A swing high was formed near $8,165 and the price remained well below the 100 hourly simple moving average.
It trimmed gains and tested the $7,700 support area. At the moment, bitcoin price seems to be trading in a contracting range below $8,000. The last swing high was near $8,034 before the price declined below the 23.6% Fib retracement level of the recent leg from the $7,728 low to $8,034 high.
More importantly, there is a key contracting triangle forming with resistance near $7,950 on the hourly chart of the BTC/USD pair. If there is an upside break above the $7,950 and $8,000 levels, the price could make another attempt to surpass the main $8,200 resistance area in the near term.
If the bulls succeed in gaining strength above the $8,200 resistance area, the price may perhaps start a short term recovery towards the $8,500 and $8,600 levels.
Fresh Decline?
If bitcoin fails to continue above the $8,000 pivot level or the $8,200 resistance zone, there is a risk of a fresh decline in the coming sessions.
An initial support is near the $7,640 level, below which the price is likely to dive towards the main $7,500 support area (as discussed using the daily chart).
Hourly MACD – The MACD is slowly moving in the bullish zone.
Hourly RSI (Relative Strength Index) – The RSI for BTC/USD is currently flat near the 45 level.
Major Support Levels – $7,800 followed by $7,640.
Major Resistance Levels – $8,000, $8,200 and $8,500.


0 Comments