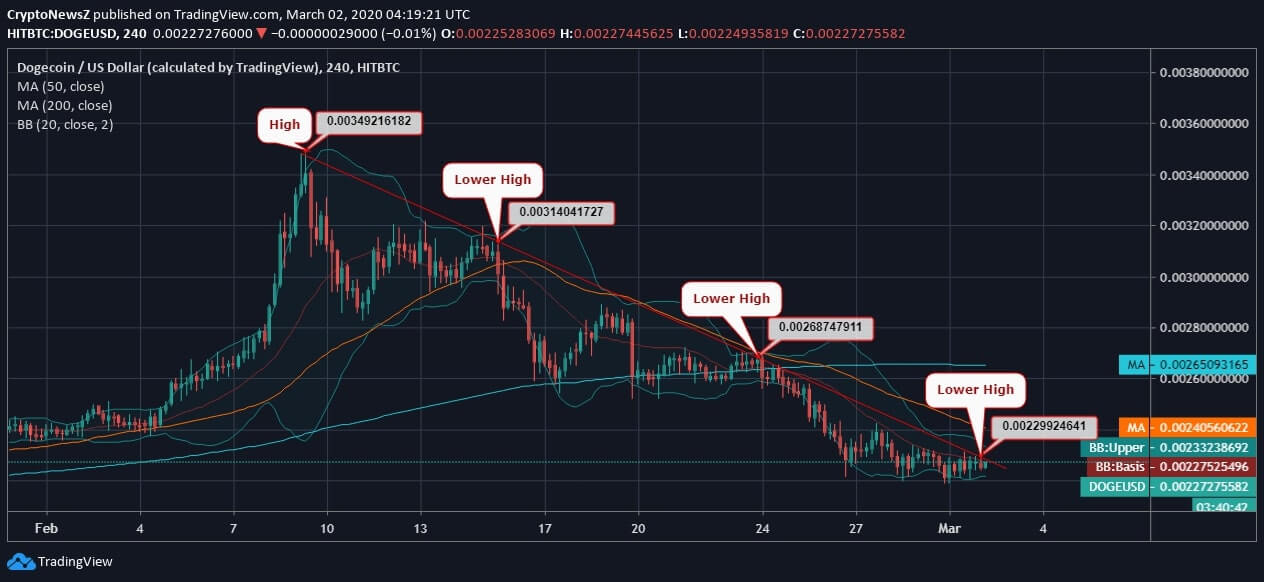
- Dogecoin trades sideways after mounting at $0.00349; currently trades at $0.00227
- DOGE/USD lacks support from the daily moving averages as the price trend forms consistent lower highs since the second week of the previous month
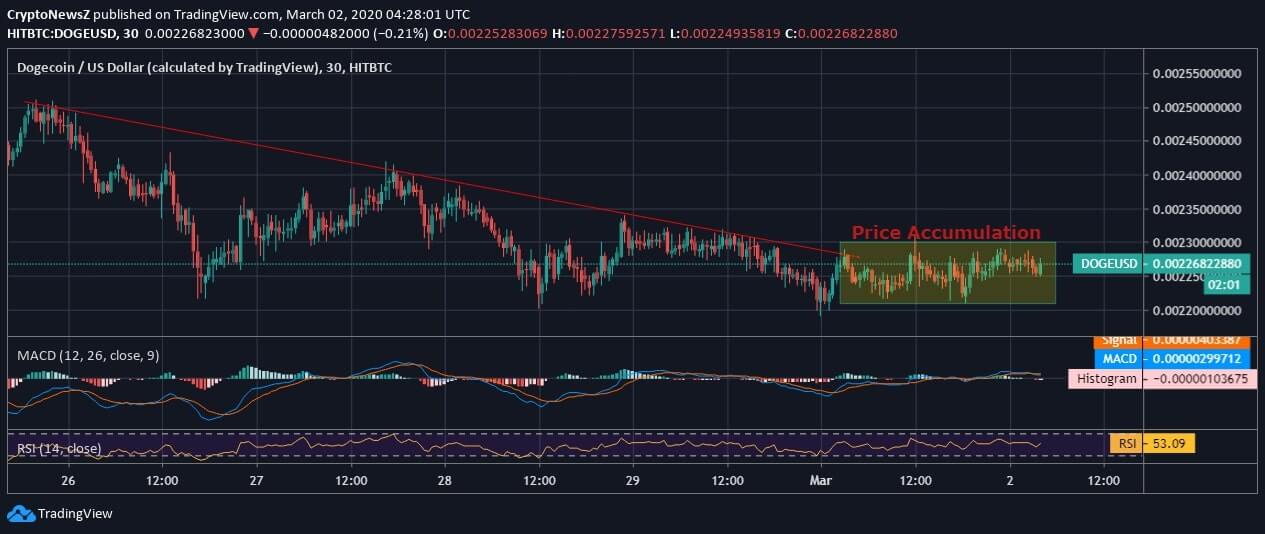
- Presently, the price of Dogecoin is seen accumulating over the past 2 days, from the beginning of March 2020, however, the downtrend remained intact before this price accumulation
- The 20-day Bollinger Bands are seen squeezing and the price trend is likely to breakout soon
Dogecoin faced a constant pullback in the previous month after it had hit a fresh 90-day high at $0.00349. It has gradually tested all the imminent supports at $0.0030, $0.0025 and $0.0023, over the past 3 weeks and is currently bottoming out around $0.0022.
Dogecoin Price Analysis:

Analyzing the 4-hourly chart of Dogecoin against US Dollar, we see that the coin was on a continual downswing within the given period. Over the last week, DOGE price lost support from the 50-day and 200-day Moving Average and also holds a “death crossover” on the hourly chart as the 200-day MA crosses above the short-term MA. With this, the coin gradually breached the major support that was forming around $0.0023.
Moreover, the 20-day Bollinger Bands laid are seen squeezing as the band width narrows and we project Dogecoin Price trend to breakthrough the lower band, as per the current momentum and support.
The half-hourly chart also exhibits a notable downtrend until the end of the previous month. However, unable to hold, Dogecoin price extended its dip against the US Dollar as it fell below $0.0023.
The technical indicators laid show quite a flat movement as the price accumulates and the MACD of DOGE is seen intersecting with the Signal line, while RSI lies at 53.09 and withholds no trading extremities.


0 Comments