- Ethereum price defends $220 support and grinds closer to the resistance at $230.
- ETH/USD lags a falling wedge breakout that could propel it back to the highest levels of February 2020.
Ethereum price has recovered from a most recent dip to $220 support. The losses came after the bulls were unable to break the resistance at $235 for the second time in just four days. At the same time, the support at $230 failed to contain the gains accrued following the formidable recovery from the major support at $210.
In the meantime, ETH/USD is trading at $227 as bulls beat on the resistance at the 23.6% Fibonacci level of the last swing high at $290.44 to a swing low of $210. The bullish action on Wednesday has seen Ethereum price add over 1.5% to its value compared to Bitcoin (BTC) 0.62% and Ripple (XRP) 0.57% growth.
In addition to that, ETH/USD is teetering under the moving averages; whereby the 50 SMA on the 4-hour chart is standing in the line of growth at $230.42 and the 100 SMA at $247.86. Besides the resistance at $230 and $235, more seller congestion is expected at $240.
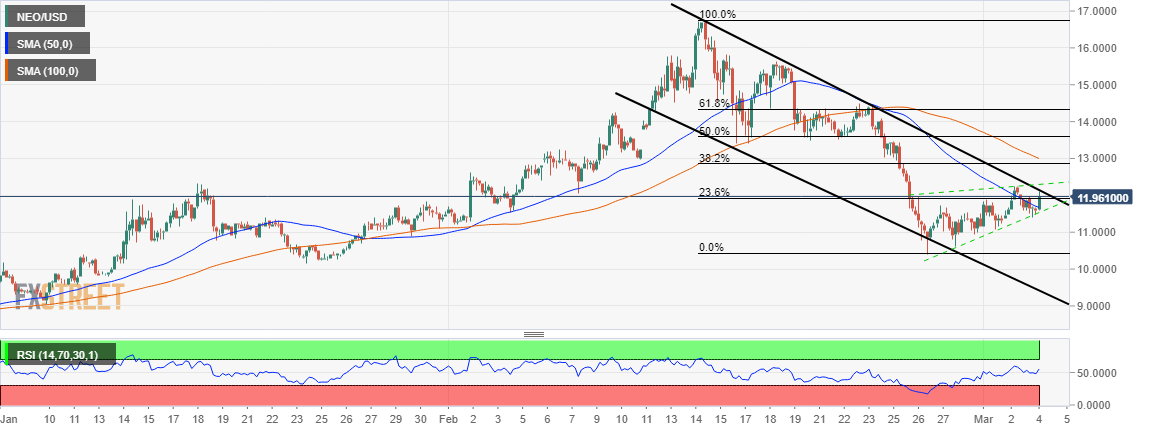
ETH/USD 4-hour chart

Falling Wedge Pattern Breakout
The losses from the highs recorded in February have seen Ethereum price form a lower high and lower pattern, resulting in the formation of a narrowing falling wedge pattern. As recovery continues, Ethereum grinds closer to this pattern breakout, whose impact could boost the price above several key resistance levels such as $260 and $280 respectively.
For now, the RSI shows that the path of least resistance is sideways. In this case, the Ethereum price could continue trading under $230 and above the support at $220 ahead of the above breakout.
ETH/USD Key Levels
Spot rate: $227.40
Relative change: 3.00
Percentage change: 1.37%
Trend: Ranging
Support: $220 and $210
Resistance: $230, $235 and $240.
from Coingape https://coingape.com/ethereum-price-bullish-pattern-potential-rocket-back-280/


0 Comments