


On March 7, the ETH price reached a high of ₿0.0274. It has been rapidly decreasing since, indicative that it is in the markdown stage. The closest significant support area is found at ₿0.02.
Ethereum (ETH) Price Highlights
- The price has completed the redistribution stage.
- There is support at ₿0.02.
- The price is possibly following a descending support line.
- There is resistance at ₿0.025.
Wyckoff distribution theory suggests that there is a proportionate effect for every cause in the market. Therefore, every accumulation stage is followed by a markup, distribution, and a markdown phase. We have previously used this distribution to make a prediction about the Bitcoin price. Well-known trader @TraderX0X0 outlined an Ethereum chart, stating that the price might be following these stages of the Wyckoff distribution. If so, the price is currently in the markdown stage, which is expected to take it even lower.
Beautiful market cycle playing out on $ETHBTC – H4 timeframe
Distribution top during Feb – Mar
Mark down early march
Redistribution – aka throwback to the distribution break down level
And now what looks to be a second markdown leg playing out pic.twitter.com/OwycQ7Gii9
— TraderXO (@TraderX0X0) March 17, 2020
Will the Ethereum price decrease as outlined in the tweet? Continue reading below if you are interested in finding out.
Current Movement
Beginning on Dec. 23, 2019, the Ethereum price began its accumulation stage between ₿0.0175-₿0.0195. This lasted for 40 days, until the Feb. 2, 2020 breakout, which was succeeded by a very rapid price increase that continued for two weeks.
The next stage is the re-distribution one, which looks almost identical to the inverse of the accumulation stage and lasted around 29 days between the prices of ₿0.025-₿0.028. Currently, the price seems to be in its markdown stage.
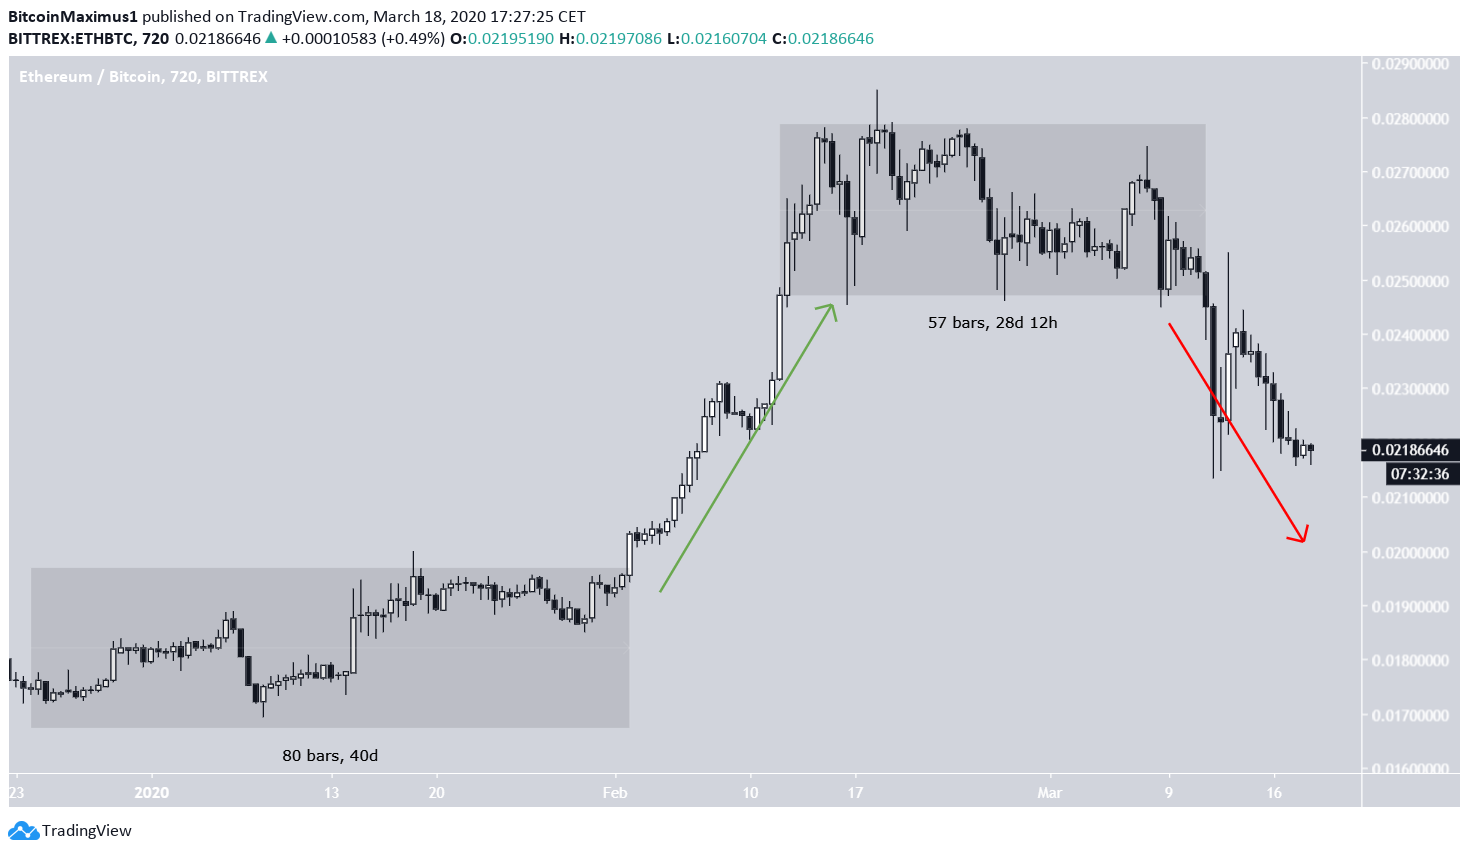
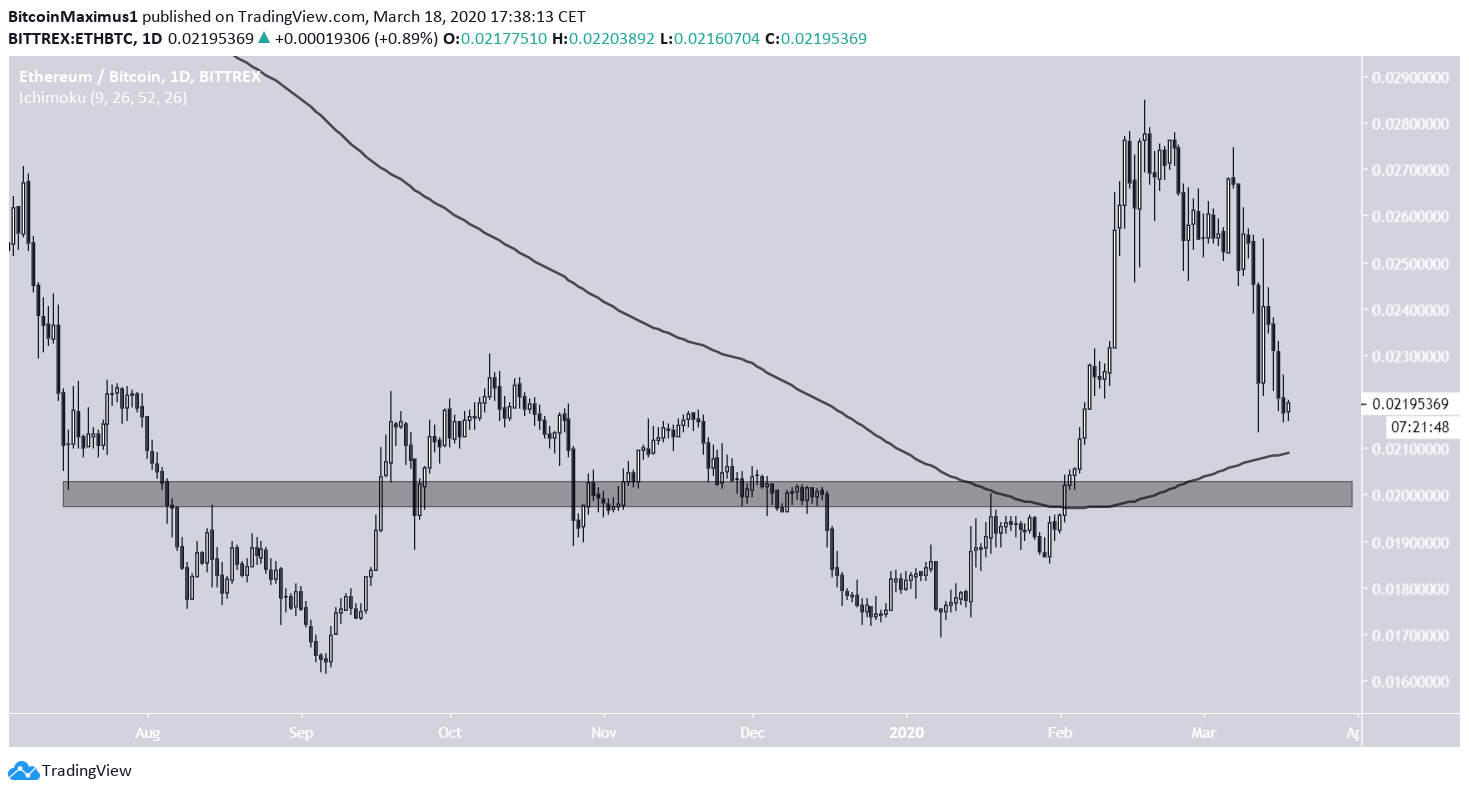
The main support area is found at ₿0.02, which is also supported by the presence of the 200-day moving average (MA). Therefore, it would be an optimal level for the markdown stage to come to a conclusion.
Descending Support Line
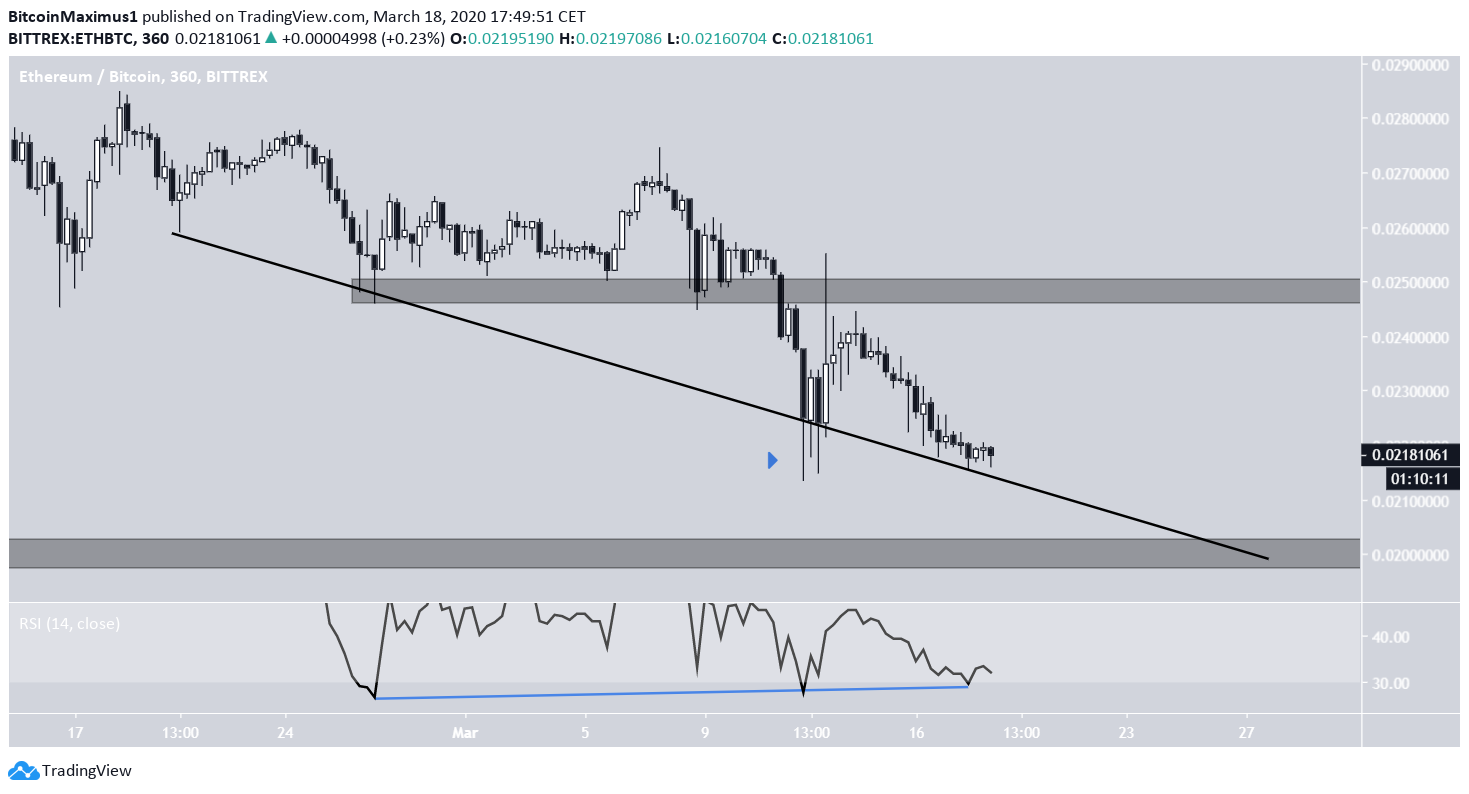
A look at a lower time-frame reveals that ETH has been following a descending support line since Feb. 20. If it continues doing so, the price is expected to reach the support area of ₿0.020 by the end of March.
However, the current level might initiate a short-term bounce. There are three main reasons for this:
- The price is inside a minor support area created by the previous long lower wicks.
- There is considerable bullish divergence developing in the RSI.
- The price is right at the descending support line.
However, due to our long-term view, this bounce is expected to end at the resistance area of ₿0.025 and the price is likely to continue its decrease towards the support at ₿0.02.
To conclude, the Ethereum price is likely in the markdown stage of a Wyckoff distribution. The price is expected to reach the major support area at ₿0.02. A short-term bounce towards ₿0.025 could occur prior.
The post Ethereum’s Price Movement Explained by the Wyckoff Distribution appeared first on BeInCrypto.
from BeInCrypto https://beincrypto.com/ethereums-price-movement-explained-by-the-wyckoff-distribution/


0 Comments