The Bitcoin price pumped hard on Wednesday, reaching a local high of more than $9,400 on some exchanges. The price move is among Bitcoin’s largest ever single-day upswings by dollar value.
There have been a total of 14 days before now that saw the Bitcoin price gain more than $1,000 in just 24 hours. However, a look into history shows that such moves might not be as bullish as one may presume.
BTC at the Races: Historic Price Moves Lead into Month of Bitcoin Halving
Bitcoin is no stranger to volatility. In its 11-year history, the leading cryptocurrency has seen many price swings, both up and down, that make all but the most extreme moves on Wall Street look tame.
Wednesday was one such day. At around 08:00 GMT, BTC traded close to $7,900. Just 24 hours later, it set a local top of more than $9,400. Typically, as BeInCrypto reported, the volatility coincided with a major cryptocurrency exchange dropping services — much to the chagrin of traders.
Leading into the month of the third Bitcoin halving, such price moves might seem bullish at first glance. However, history suggests that Bitcoin’s more violent upswings tend to precede losses.
What Goes Up…
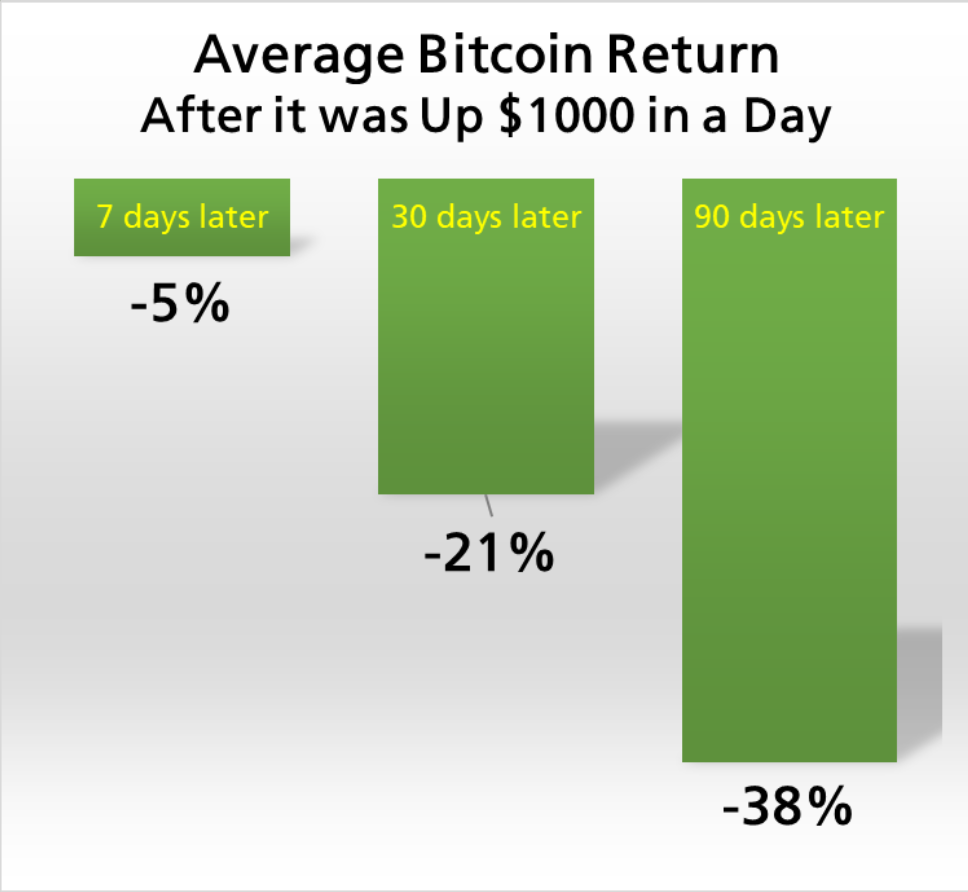
As Timothy Peterson, CFA at Cane Island Alternative Advisors, pointed out via Twitter, there have only been 13 other occasions that saw the BTC price gain by more than $1,000 in a single 24-hour session. On average, substantial losses have occurred in the weeks and months that follow.
A graphic posted alongside Peterson’s tweet shows the average one-week, one-month, and three-month returns after Bitcoin’s four-figure, single-day increases. The seven days, 30 days, and 90 days following one of these bumper days of gains sees losses of 5, 21, and 38 percent, respectively.

The month that saw the largest historical Bitcoin price increase ever, December 2017, experienced several days of spectacular $1,000+ gains. The high point, close to $20,000, would begin a year-long downtrend, involving some of the biggest single-day losses. Although the one-week price performance for some of these earlier occasions did not necessarily see losses, the longer time frames certainly did.
In early 2018, there were also some +$1,000 days for Bitcoin. However, these short-term rallies punctuated the clear downtrend that took Bitcoin to the bear market bottom of around $3,200. Understandably, the week, month, and three-month performances following each saw big losses.
Another example that may suggest price losses are to follow yesterday’s move happened in October last year. As BeInCrypto reported at the time, Chinese premier Xi Jinping kick-started the bullish move by declaring that the major world power was interested in adopting blockchain technology.

However, in the days and weeks to follow, the price would shed most of its gains, arriving at its yearly low of around $6,600, exactly two years after Bitcoin reached its all-time high, that December.
Although such major price moves have more often than not preceded losses, some responding to Peterson disagree that the $1,000 day is the right way to go about categorizing Bitcoin’s largest ever gains. After all, a $1,000 move between $6,000 and $7,000 is far more significant than one between $16,000 and $17,000.
Many observers argued that percentage gains are the only real way to identify Bitcoin’s largest price moves. The trend described by Peterson is less pronounced using this alternative data.
The post Bitcoin Price Rises 17% but History Suggests Losses Could Follow appeared first on BeInCrypto.
from BeInCrypto https://beincrypto.com/bitcoin-price-rises-17-but-history-suggests-losses-could-follow/


0 Comments