Bitcoin traded as low as $9,165 and recently started a fresh increase against the US Dollar. BTC is currently rising, but it might struggle to clear the main $9,500 resistance zone.
- Bitcoin is showing recovery signs and trading above the $9,300 resistance zone.
- The price is likely to continue higher towards the $9,450 and $9,500 resistance levels.
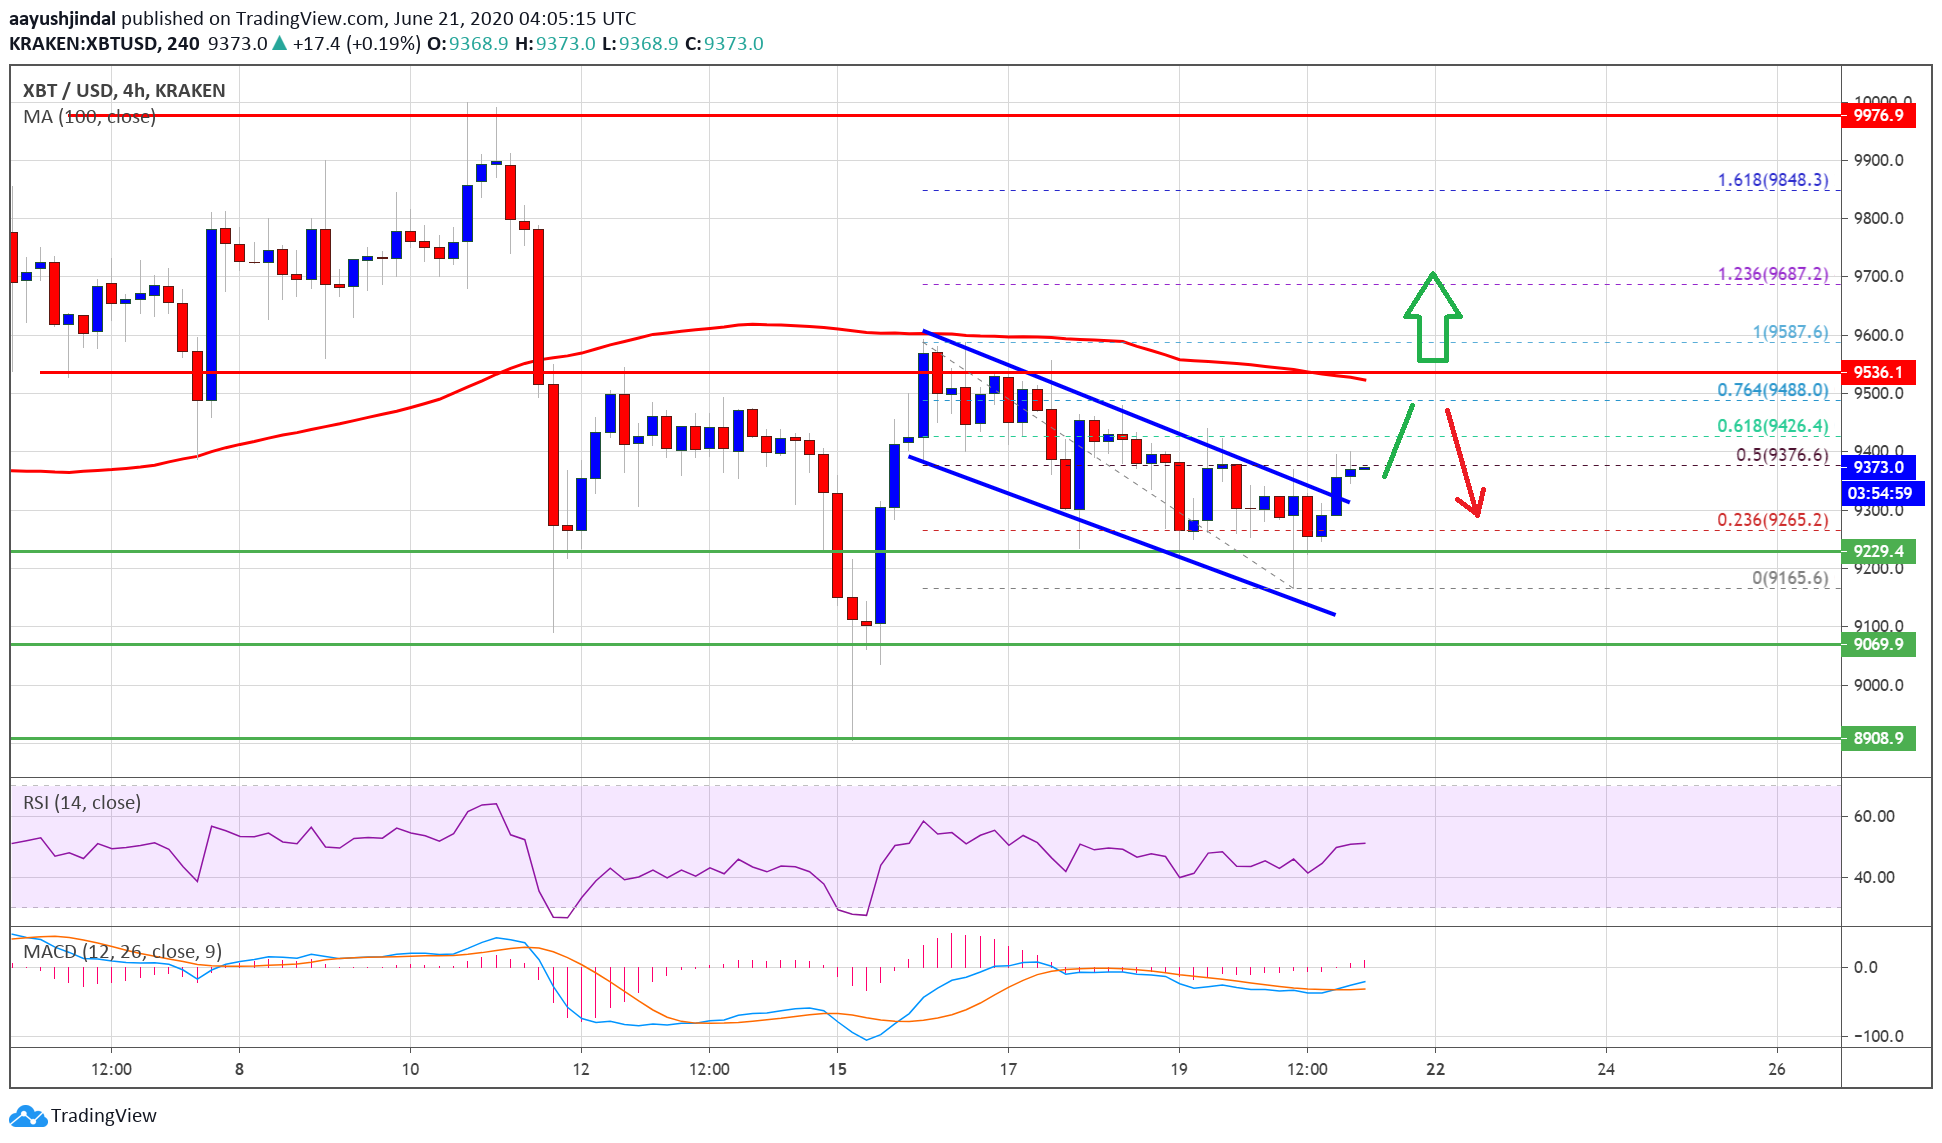
- There was a break above a major bullish flag pattern with resistance near $9,340 on the 4-hours chart of the BTC/USD pair (data feed from Kraken).
- The pair could face a strong barrier near the $9,500 level and the 100 simple moving average (4-hours).
Bitcoin is Showing Recovery Signs
This past week, bitcoin declined steadily from well above the $9,500 resistance against the US Dollar. BTC price traded below the $9,300 support level and even settled well below the 100 simple moving average (4-hours).
A swing low was formed near the $9,165 level before it started a decent upward move. There was a break above the $9,250 and $9,300 resistance levels. The bulls pushed the price above the 23.6% Fib retracement level of the downward move from the $9,587 swing high to $9,165 low.
More importantly, there was a break above a major bullish flag pattern with resistance near $9,340 on the 4-hours chart of the BTC/USD pair. It has opened the doors for more gains above the $9,350 level.
Bitcoin Grinding Higher. Source: TradingView.com
Bitcoin price is testing the 50% Fib retracement level of the downward move from the $9,587 swing high to $9,165 low. A clear break above $9,400 could set the momentum for a push towards the main $9,500 resistance zone.
The 100 simple moving average (4-hours) is also waiting near the $9,500 resistance area. Therefore, an upside break above the $9,500 resistance zone is needed for a strong upside continuation. The next major hurdles are seen near the $9,800 and $9,840 levels.
Fresh Decline in BTC?
If bitcoin struggles to clear the $9,400 and $9,500 resistance levels, there is a risk of a fresh decline. An initial support is near the broken flag resistance at $9,300.
The main support is now forming near the $9,080 level, below which there is a risk of a larger decline below the $9,000 support in the coming sessions.
Technical indicators
4 hours MACD – The MACD for BTC/USD is slowly gaining in the bullish zone.
4 hours RSI (Relative Strength Index) – The RSI for BTC/USD is currently just above the 50 level.
Major Support Level – $9,300
Major Resistance Level – $9,500
Take advantage of the trading opportunities with Plus500
Risk disclaimer: 76.4% of retail CFD accounts lose money.
from NewsBTC https://www.newsbtc.com/2020/06/21/bitcoin-bullish-btc-flag-breakout-9500/?utm_source=rss&utm_medium=rss&utm_campaign=bitcoin-bullish-btc-flag-breakout-9500


0 Comments