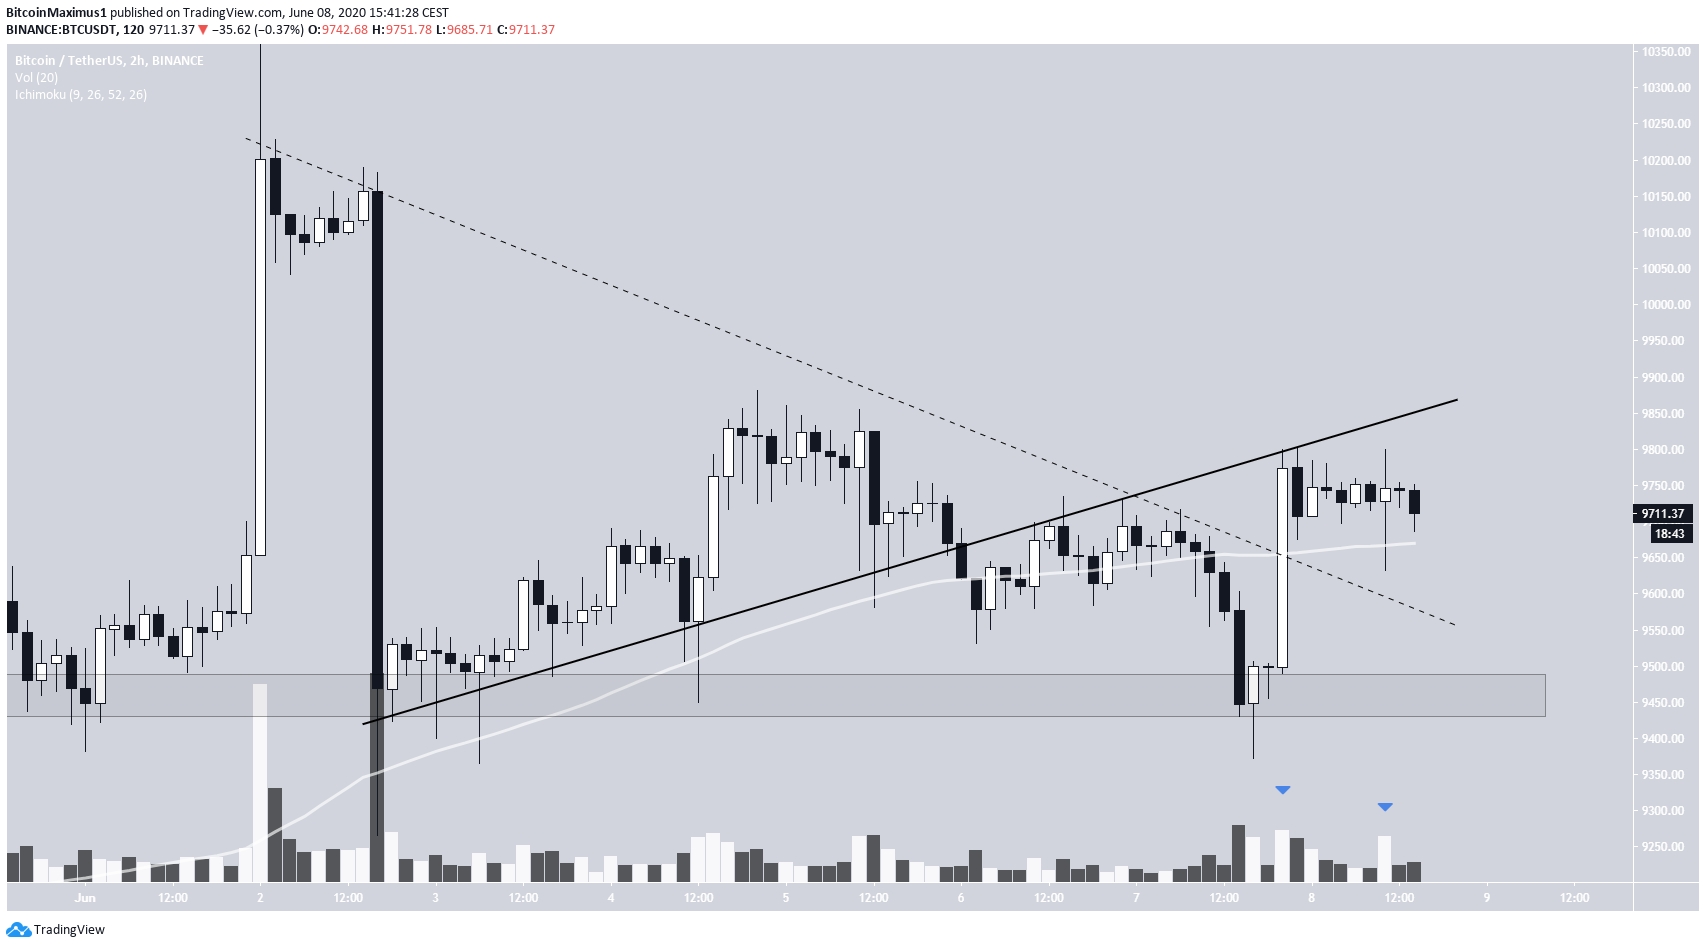
The Bitcoin price bounced at the $9,450 support area on June 7 and has been increasing since. While the price is trading inside a resistance area, an increase above would likely trigger a rapid move upwards.
Current Support
The Bitcoin price has been following a rising support line from June 2 but broke down a few days later on June 5. The next day, the price returned to validate it as resistance before dropping sharply.
However, once the price reached the $9450 support area, it quickly reversed trend and initiated a strong upward move, breaking out from the falling resistance line in place since the June 1 high (dashed line) by creating a bullish engulfing candlestick.
The breakout occurred with significant volume, and the price reclaimed the 200-hour moving average (MA). Therefore, the price may continue rising and soon reclaim the previous support line.

Cryptocurrency trader @Scottmelker saw an identical setup, which he used as an exit signal:
Right back at resistance – that line was the support where I exited my last long. Let’s see what happens next.

Future Movement
Despite the previous rally, BTC has still created a lower high relative to the June 4 increase, which touched the 0.5 Fib level.
There are two scenarios for price movements here:
- The bullish one, which seems more likely, would have the price increase towards the next resistance levels at $9,950 and $10,110, the 0.618 and 0.765 Fib levels, respectively. A rise above the latter (red line) would likely mean that the correction is over, and the price is heading towards new highs.
- The bearish one will take place if the price declines below the $9,450 area. This would likely cause a very rapid drop that brings the price well below $9,000 – in line with BeInCrypto‘s previous Wyckoff Distribution analysis.

The fundamental reason here is that the $9,450 support area coincides with the long-term ascending support line that has been in place since March 13. If that line is broken, BTC is likely to show major signs of weakness.
On the other hand, the $9,950 and $10,100 areas were the highs of May 6 and May 11, respectively. The price is likely to reverse if/once it gets there, however, a breakout above would likely mean that the correction is complete, and BTC will head higher.
While there is considerable long-term resistance at $10,400, there is also a higher likelihood of a breakout this time round. Resistance and support areas become weaker with each additional test.

To conclude, the direction of Bitcoin’s long-term trend is still uncertain. A rally above $10,100 would indicate that the trend is bullish, while a decline below $9,450 would almost certainly be bearish.
The post Bitcoin’s Short-Term Move Could Determine Its Long-Term Trend appeared first on BeInCrypto.
from BeInCrypto https://beincrypto.com/bitcoins-short-term-move-could-determine-its-long-term-trend/


0 Comments