After rallying as high as ~$10,100 on leading exchanges this week, Bitcoin plunged off a proverbial cliff. Within 12 hours after hitting the highs, the cryptocurrency dipped by almost $1,000, crushed as long orders cascaded BTC lower.
While this was a bearish rejection at a crucial level, analysts are still bullish. They cite a confluence of technical and fundamental factors showing that the BTC trend remains slanted to the upside.
Related Reading: Crypto Tidbits: Bitcoin Fails at $10k, Ethereum Coins Explode, Coinbase Looks to Add 18 Altcoins
Bitcoin Is Prepared to Erupt to $14,000
Bitcoin’s recently price action may make it seem like a top is forming, but a fractal analysis from a leading analyst in the space has suggested the opposite.
A fractal in financial markets is when a bout of price action is experienced again at another time and for the same or another asset. As Investopedia explains:
“Fractals also refer to a recurring pattern that occurs amid larger more chaotic price movements.”
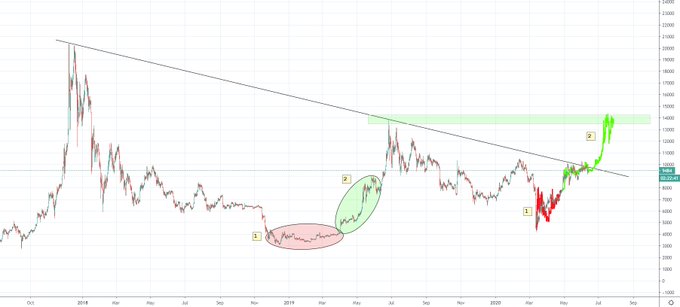
The analyst suggested that a fractal has formed between the start of 2019’s 300% rally and BTC’s price action over the past few weeks. The fractal suggests that BTC will trade as high as $14,000 by the middle of July.
As a pertinent aside: the analyst who shared the chart below is known for observing accurate fractals, which predicted a number of key swings over the past year.

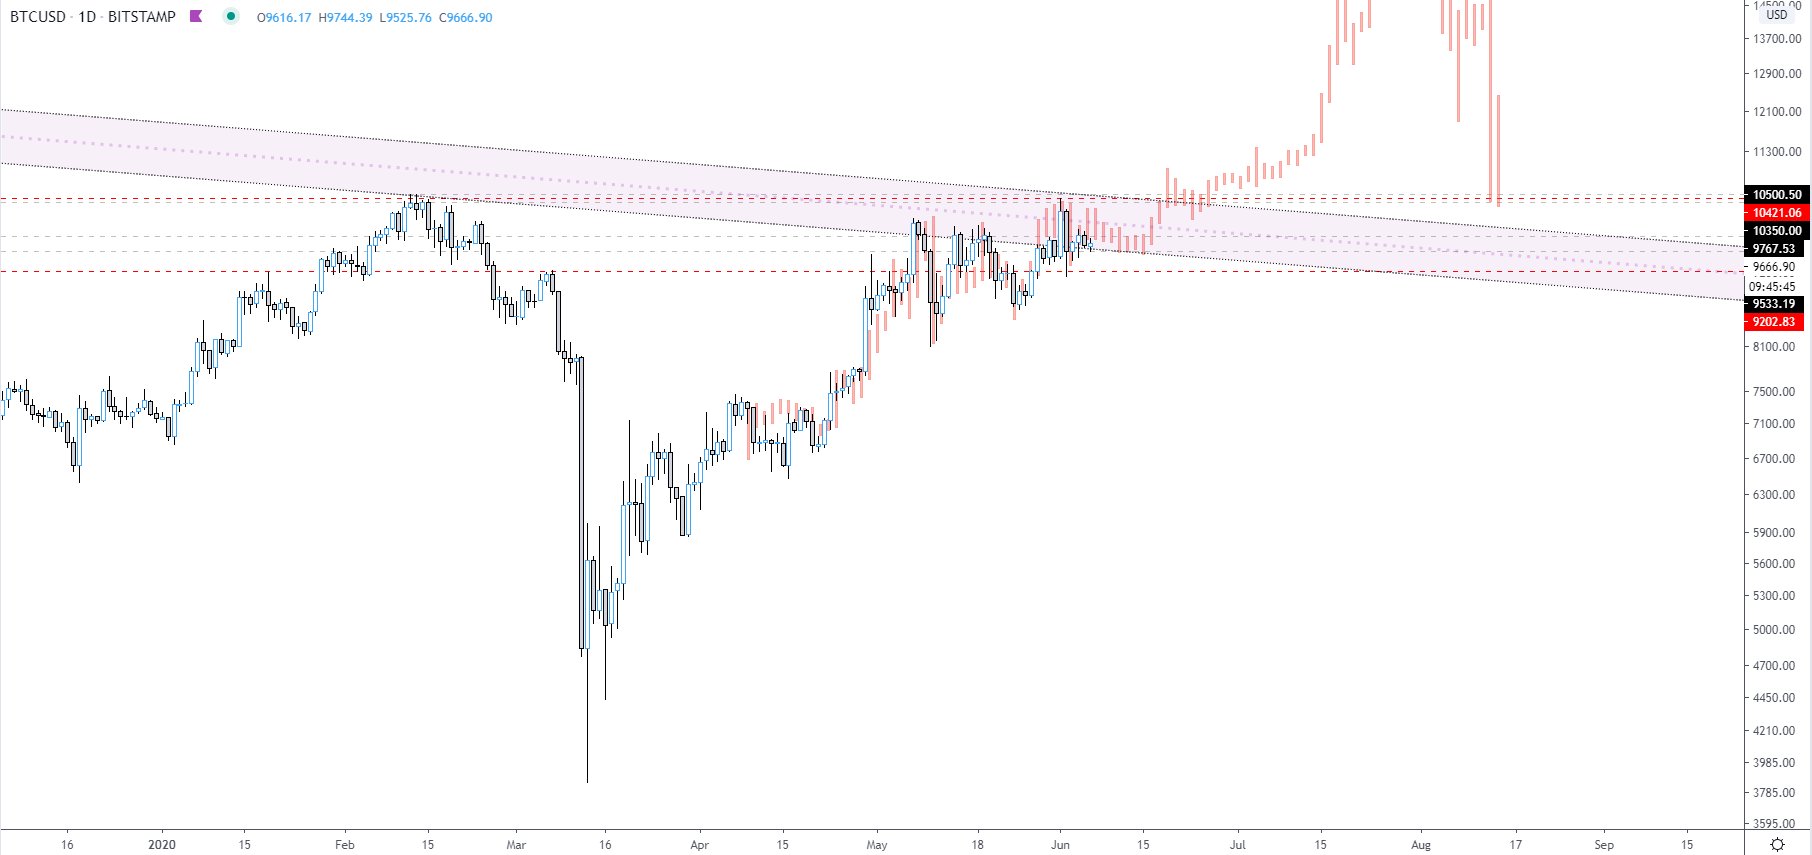
This, importantly, isn’t the only $14,000 fractal.
The same technical analyst that predicted Bitcoin bottomed at $3,700 just hours after the crash on March 13th recently shared the chart below.
The chart is of a fractal showing that Bitcoin will hit $14,000 in the coming five to six weeks, just as the first analyst mentioned remarked:
“Scary fitting fractal from EO 2016 Cut of the top part to not trigger anyone If we see anything like it… inverse capitulation becomes real,” he remarked in reference to the chart below and how crypto investors are expecting “capitulation.”

Other Technical Signs Also Signal Upside
There are other analysts that believe it’s only a matter of time before Bitcoin revisits the pivotal $14,000 level, just like it did in 2019.
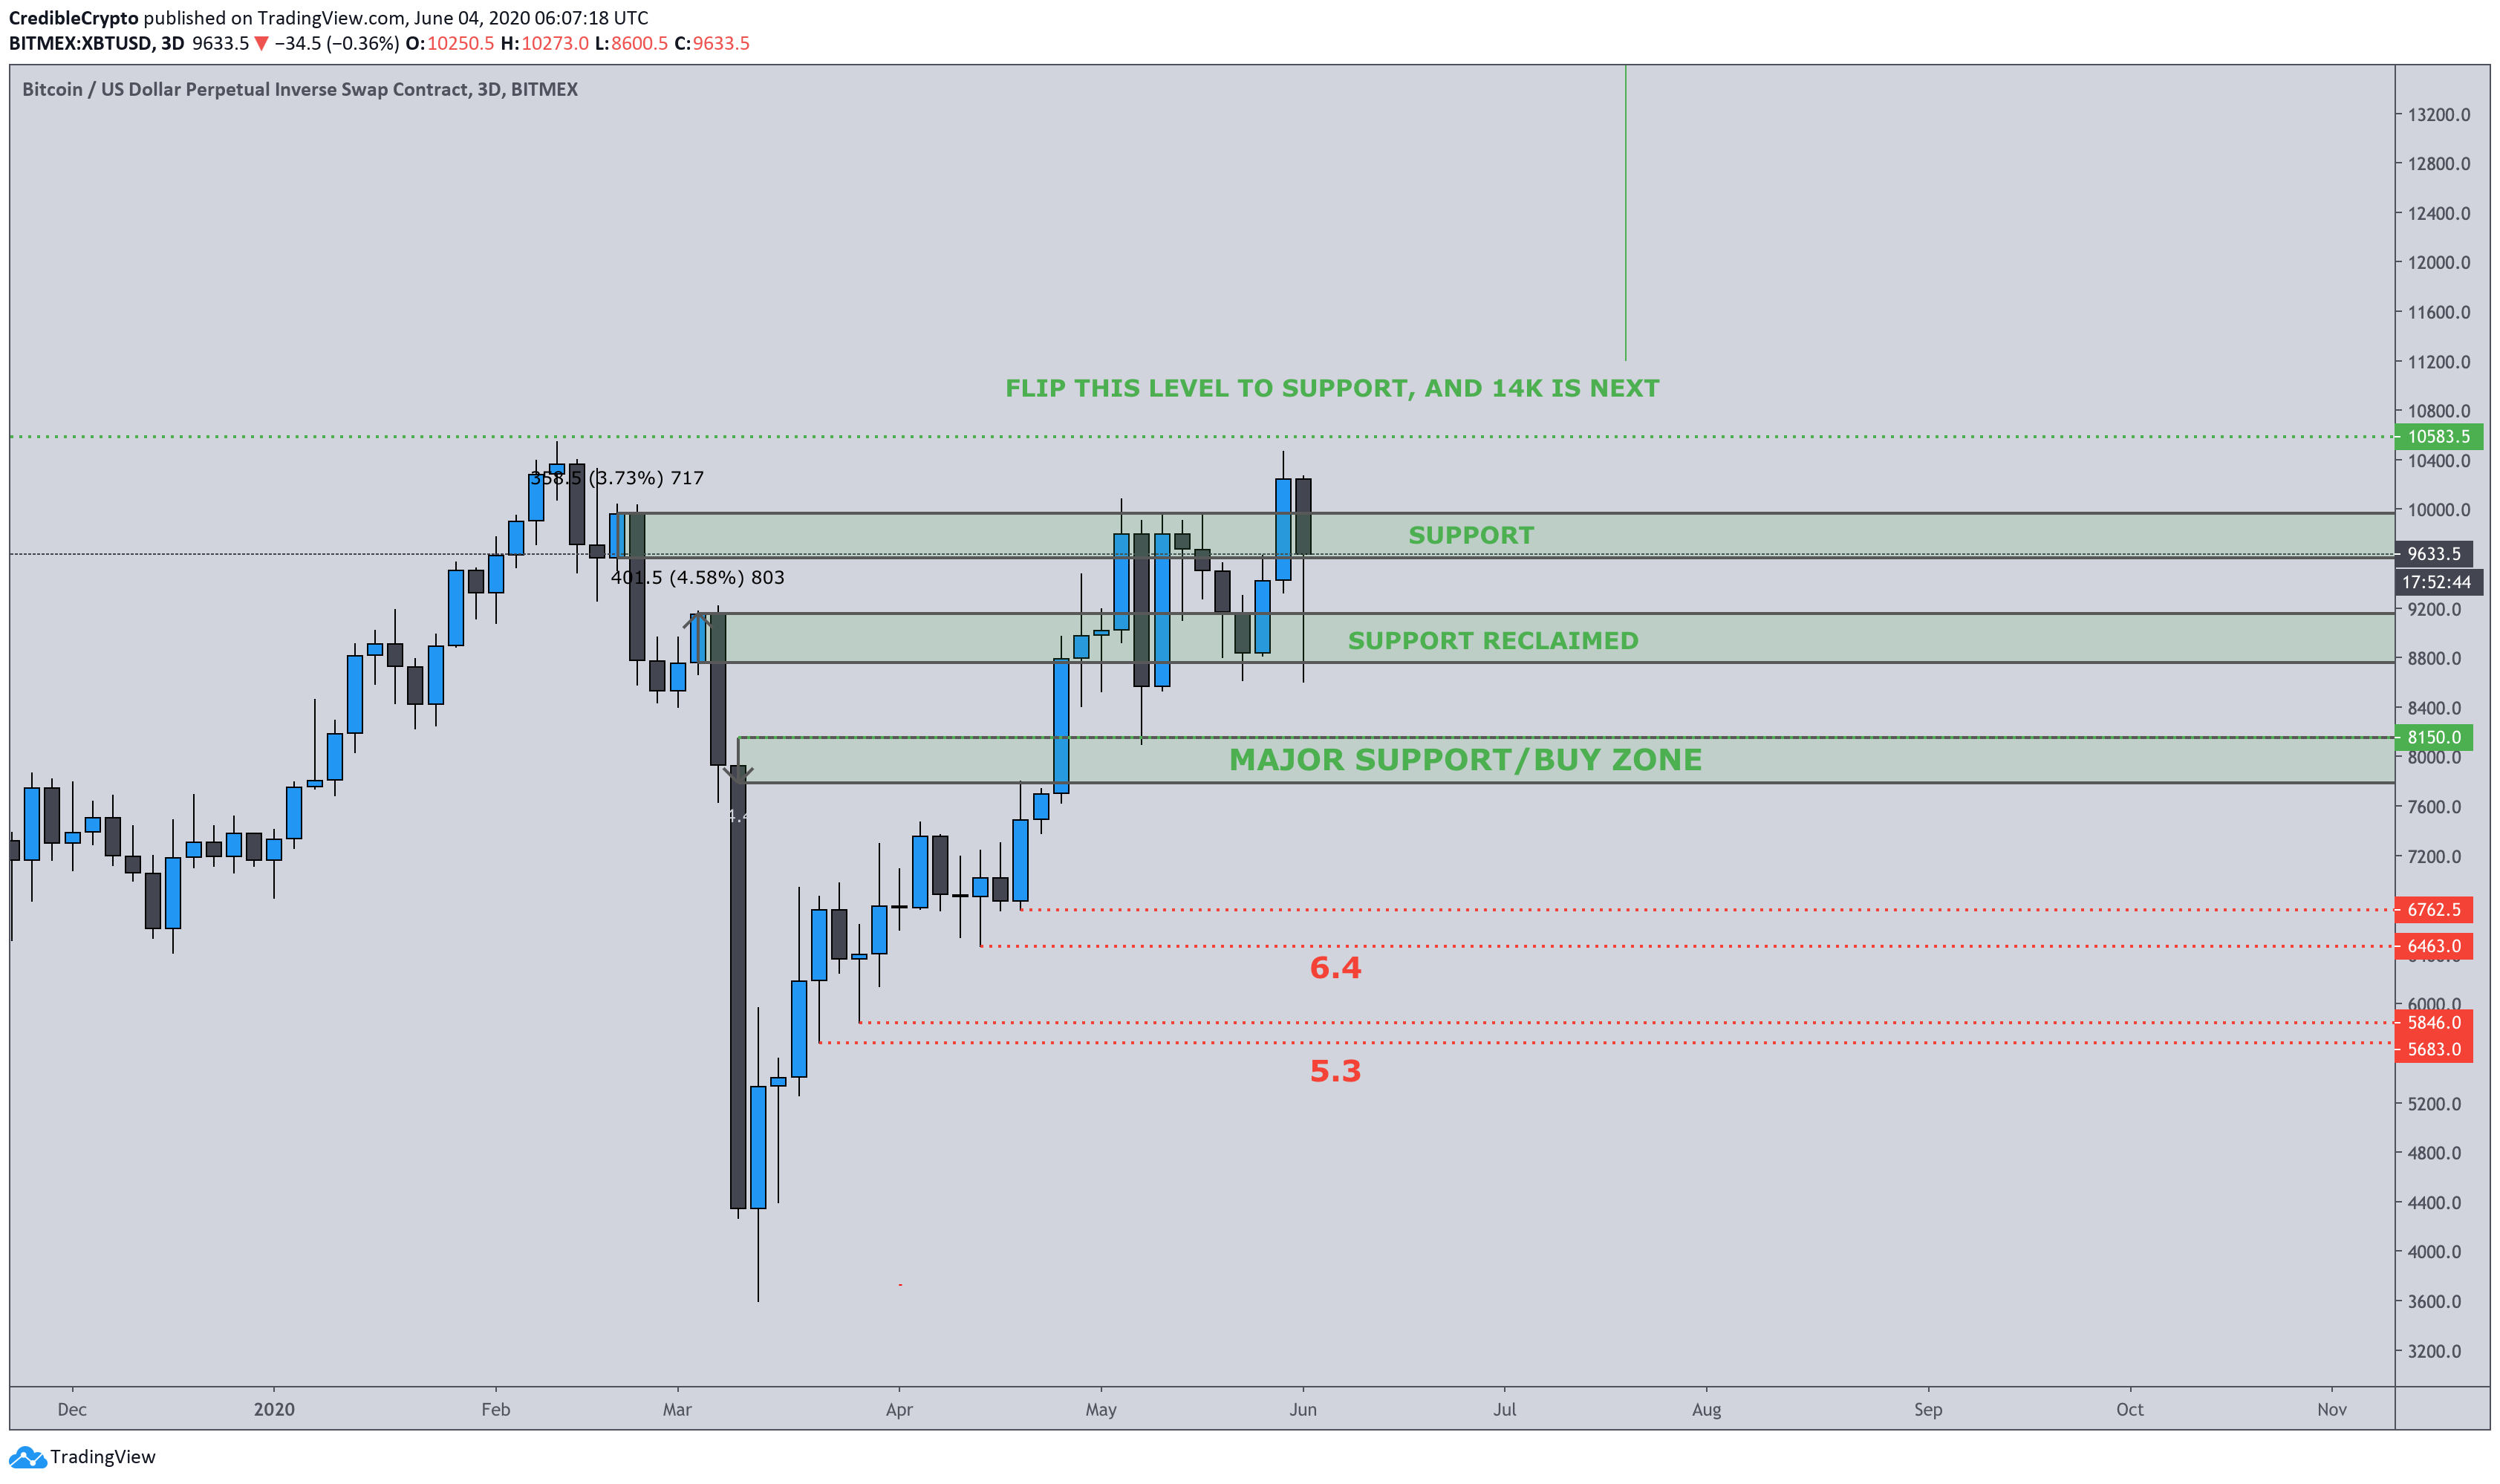
One trader recently argued that Bitcoin flipping the $10,500 into support will lead to a rapid move to $14,000.

“Don’t lose sight of the HTF… Our prior resistance region has now been broken and is now being tested as support. Bulls remain in control and gunning for the highs again imo. HTF has been bullish since posting this weeks ago,” he opined in reference to the chart seen above.
Related Reading: Over a Dozen Top Crypto Assets Are Up Over 10% Today: Here’s Why
Featured Image from Shutterstock
Price tags: xbtusd, btcusd, btcusdt
Eerie Bitcoin Fractal Predicts It May Be Just Weeks Before BTC Hits $14,000
from NewsBTC https://www.newsbtc.com/2020/06/13/eerie-bitcoin-fractal-just-weeks-btc-hits-14000/?utm_source=rss&utm_medium=rss&utm_campaign=eerie-bitcoin-fractal-just-weeks-btc-hits-14000


0 Comments