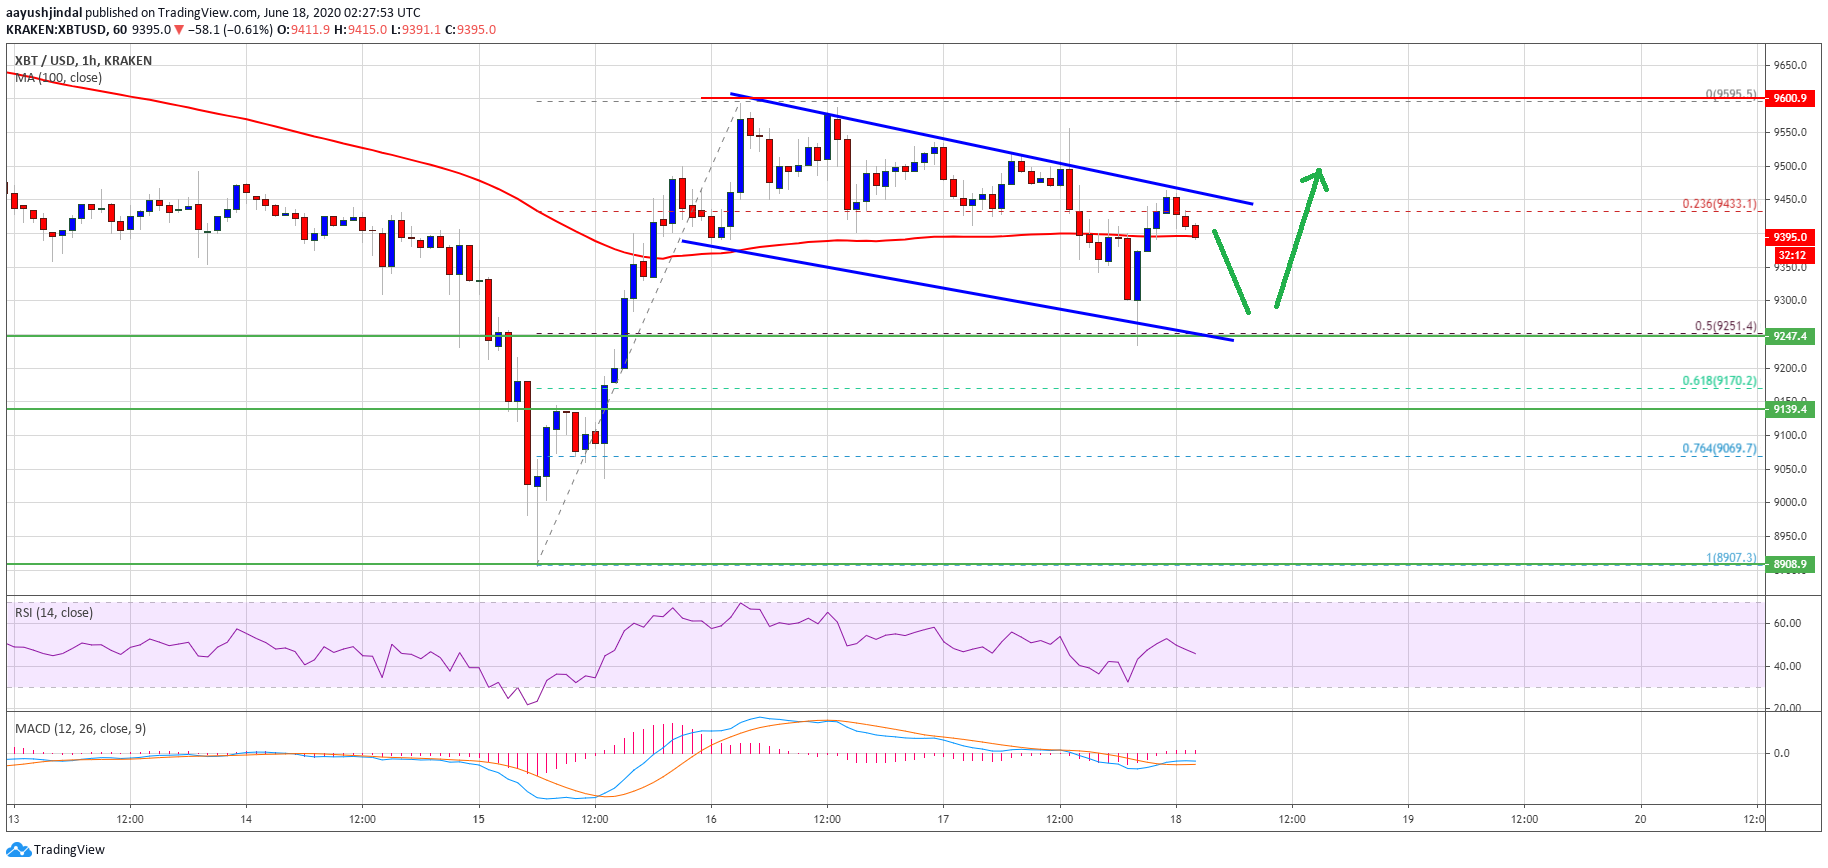
Bitcoin climbed higher above $9,500, but it struggled to clear $9,600 against the US Dollar. BTC is now correcting gains and it seems like there is a bullish flag forming with resistance at $9,450.
- Bitcoin is currently correcting lower from the $9,595 swing high.
- The price is trading well below the $9,500 pivot level and testing the 100 hourly simple moving average.
- There is a bullish flag pattern is likely forming with current resistance near $9,450 on the hourly chart of the BTC/USD pair (data feed from Kraken).
- The pair could dip a few points, but it is likely to surge above $9,500 as long as the $9,250 support holds.
Bitcoin Price Could Continue Higher
After a strong recovery wave, bitcoin price extended its rise above the $9,500 resistance against the US Dollar. BTC even surpassed the $9,580 level, but it faced sellers near the $9,600 level.
A high is formed near $9,595 and the price is currently correcting lower. It declined below the $9,500 level and the 100 hourly simple moving average. The decline was such that the price even tested the 50% Fib retracement level of the recovery wave from the $8,907 swing low to $9,595 swing high.
It seems like there is a bullish flag pattern is likely forming with current resistance near $9,450 on the hourly chart of the BTC/USD pair. To continue higher, bitcoin must break the channel resistance zone at $9,450.

An immediate resistance is near the $9,500 level, above which the bulls are likely to aim a clear break above the $9,600 resistance zone. The next major resistance is seen near the $9,800 level, followed by the all-important $10,000 barrier (as discussed in yesterday’s analysis using the daily chart).
Downside Break in BTC?
If bitcoin struggles to surpass the channel resistance and $9,500, there is a risk of another bearish reaction. The first major support is near the $9,250 level.
A downside break below the $9,250 support could negate the current bullish view. In the stated case, the price could continue to decline towards $9,080 or the 76.4% Fib retracement level of the recovery wave from the $8,907 swing low to $9,595 swing high. Any further losses could lead the price towards $9,000.
Technical indicators:
Hourly MACD – The MACD is slowly moving in the bullish zone.
Hourly RSI (Relative Strength Index) – The RSI for BTC/USD is currently below the 50 level, with a bearish angle.
Major Support Levels – $9,250 followed by $9,080.
Major Resistance Levels – $9,450, $9,500 and $9,800.
from NewsBTC https://www.newsbtc.com/2020/06/18/bitcoin-btc-could-lift-off-9500/?utm_source=rss&utm_medium=rss&utm_campaign=bitcoin-btc-could-lift-off-9500


0 Comments