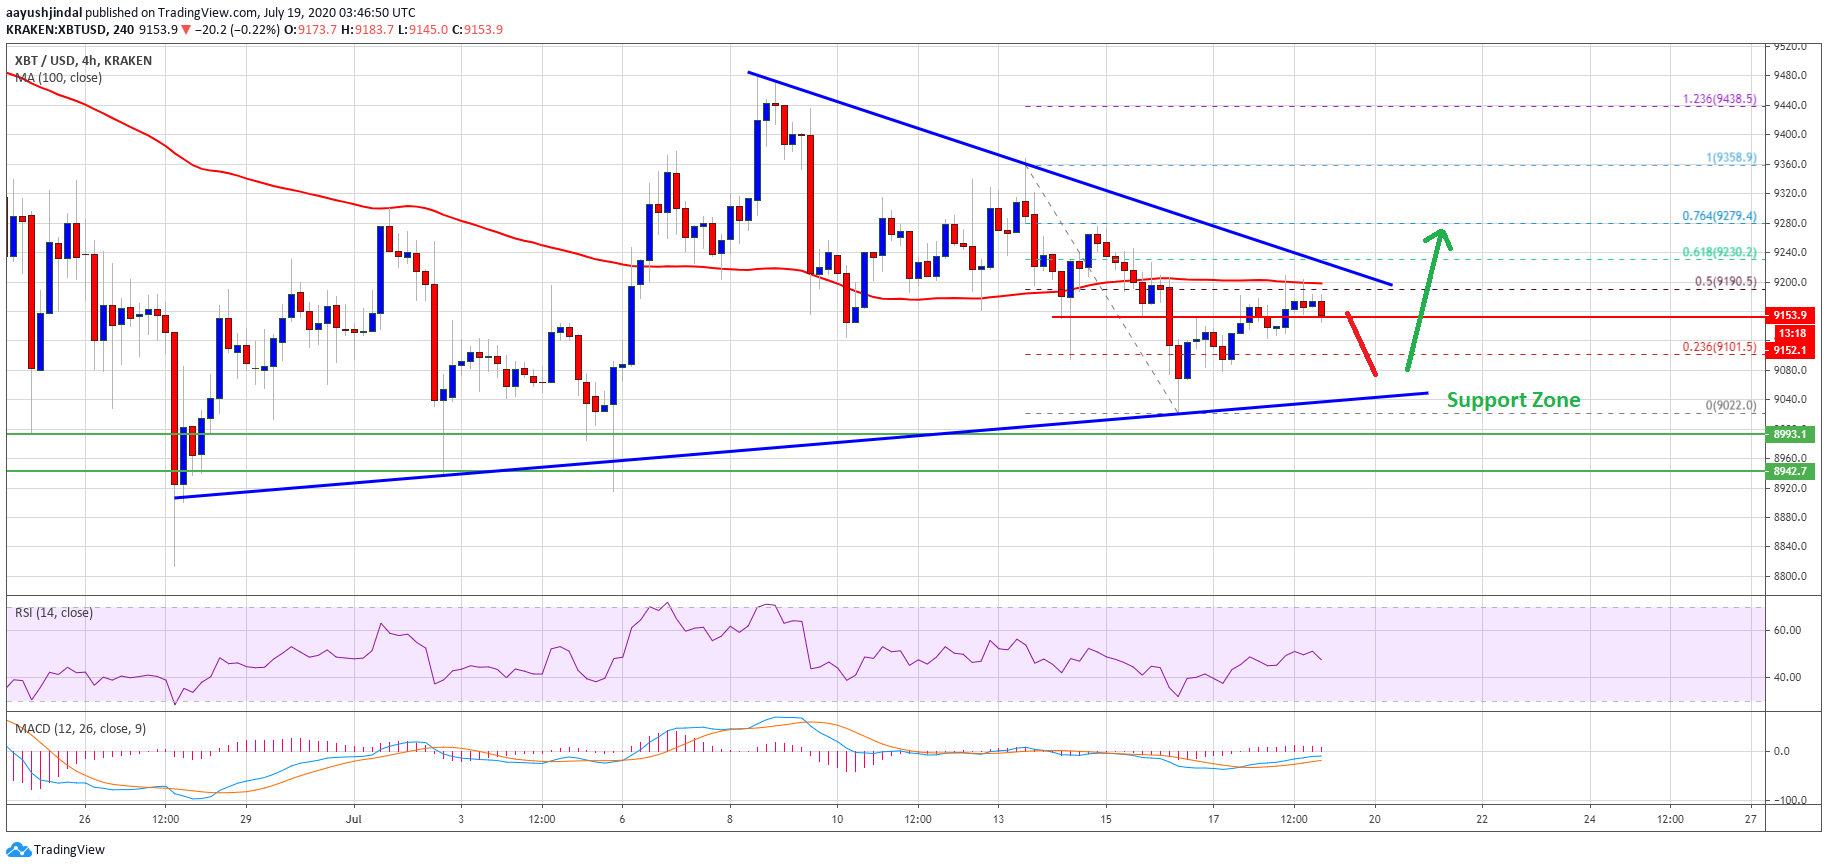
Bitcoin is struggling to clear the main $9,200 resistance area against the US Dollar. BTC is likely to start a strong rally if it clears the $9,200 resistance and the 100 SMA (H4).
- Bitcoin is facing a strong resistance near the $9,200 level and the 100 simple moving average (4-hours).
- The price could start a strong rally if it settles above the $9,200 barrier.
- There is a significant breakout pattern forming with resistance near $9,200 on the 4-hours chart of the BTC/USD pair (data feed from Kraken).
- The pair must stay above the $9,000 support level to avoid a major bearish break in the near term.
Bitcoin is Testing Crucial Resistance
This past week, bitcoin extended its decline below the $9,200 support level against the US Dollar. BTC even spiked below the $9,050 level and settled below the 100 simple moving average (4-hours).
A low was formed near $9,022 and recently the price started an upside correction. It surpassed the $9,100 and $9,120 levels. There was a break above the 23.6% Fib retracement level of the recent decline from the $9,358 high to $9,022 low.
However, the price is now facing a strong resistance near the $9,200 level and the 100 simple moving average (4-hours). There is also a significant breakout pattern forming with resistance near $9,200 on the 4-hours chart of the BTC/USD pair.
Bitcoin price trades below $9,200: Source: TradingView.com
The triangle resistance is close to the 50% Fib retracement level of the recent decline from the $9,358 high to $9,022 low. A clear break above the $9,200 level and the 100 simple moving average (4-hours) is needed to start a strong rally in the coming days.
The next major resistance above the $9,200 level is near the $9,300 level. Any further gains is likely to start a steady uptrend towards the $9,500 and $9,550 levels.
Downside Break in BTC?
If bitcoin fails to clear the $9,200 barrier and the 100 SMA, there is a risk of more losses. On the downside, the triangle support is near the $9,040 level.
The main support zone is near the $8,950 and $9,000 levels, below which there are high chances of a sharp decline towards the $8,650 and $8,500 levels.
Technical indicators
4 hours MACD – The MACD for BTC/USD is slowly losing momentum in the bullish zone.
4 hours RSI (Relative Strength Index) – The RSI for BTC/USD is currently struggling to clear the 50 level.
Major Support Level – $9,000
Major Resistance Level – $9,200
Take advantage of the trading opportunities with Plus500
Risk disclaimer: 76.4% of retail CFD accounts lose money.
from NewsBTC https://www.newsbtc.com/2020/07/19/bitcoin-btc-could-rally-above-100-sma/?utm_source=rss&utm_medium=rss&utm_campaign=bitcoin-btc-could-rally-above-100-sma


0 Comments