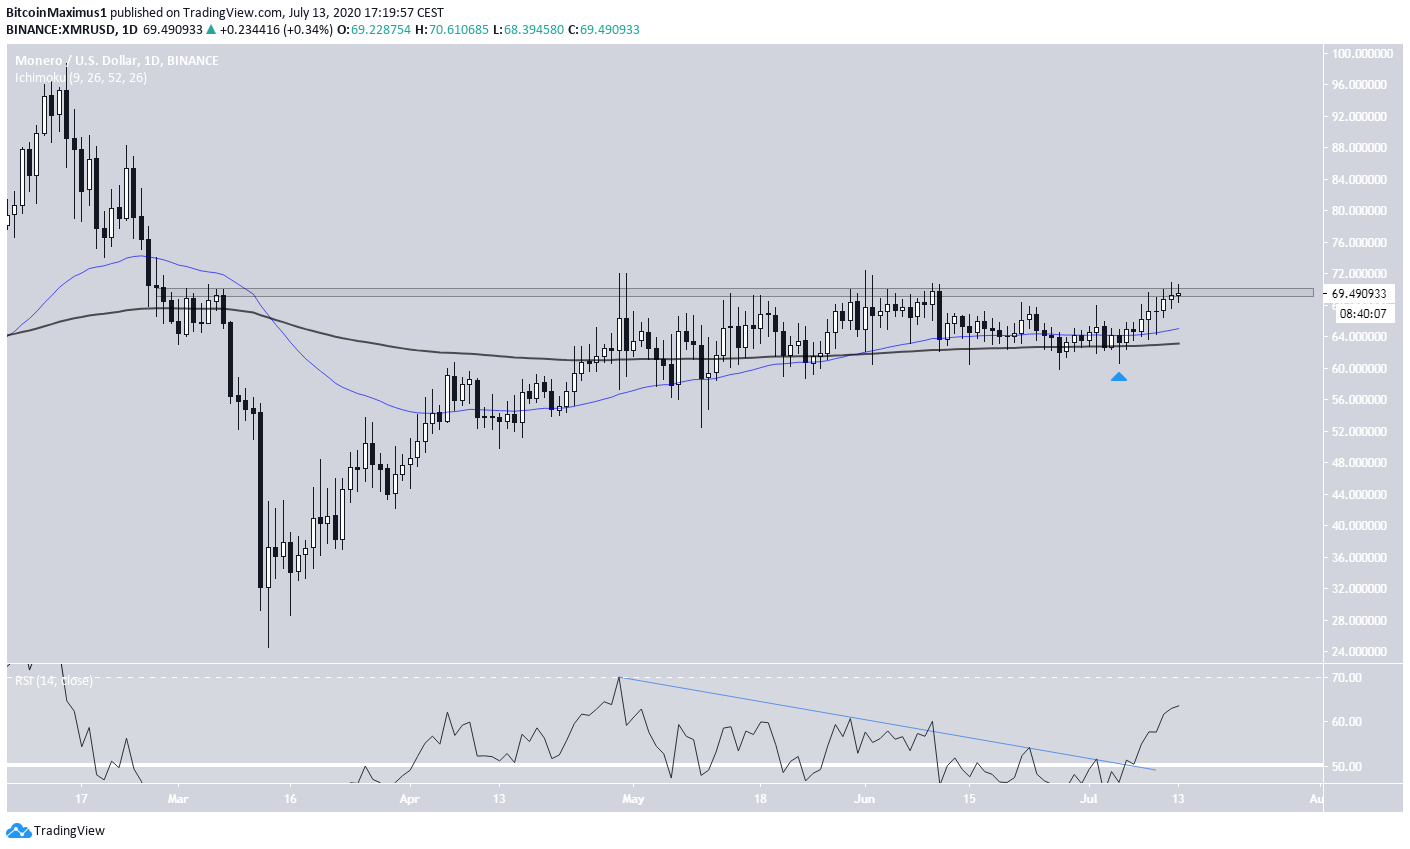
The Monero (XMR) price is currently making its fifth attempt at breaking out above a major resistance area.
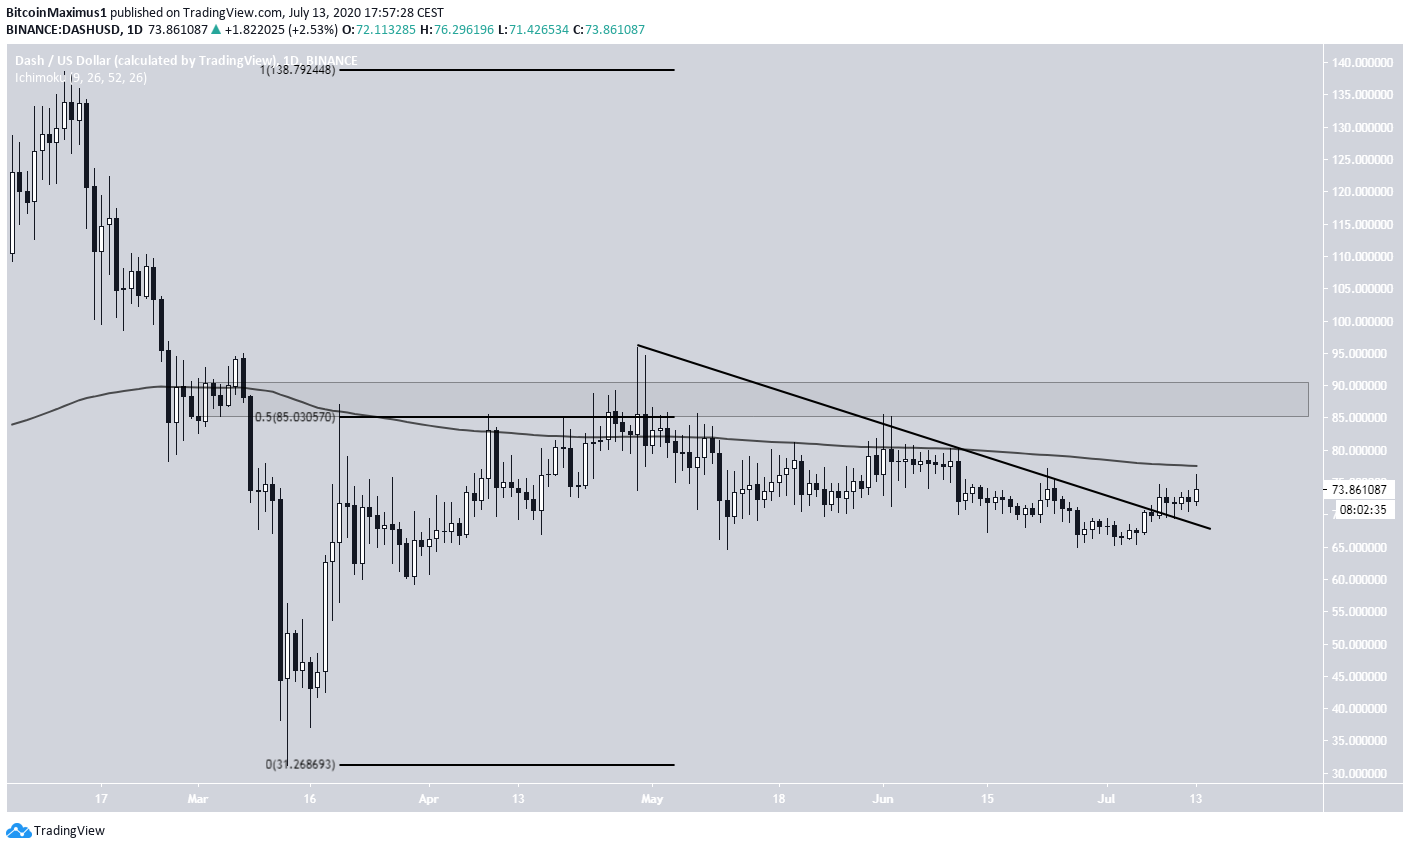
The Dash (DASH) price broke out from a descending resistance line and has begun an upward move.
Monero (XMR)
The XMR price has been increasing since it made a bottom on March 13. However, the price reached a high of $69.73 on June 10 but failed to close above the $69.50 resistance area since.
Technical indicators are bullish. While on the previous three attempts at breaking out, the RSI generated bearish divergence, the trend-line has been broken since and the RSI is now moving upwards.
Furthermore, the 50 and 200-day moving averages (MA) have made a bullish cross, and the price is trading above both, a sign that it has already begun a bullish trend.
Normally, a resistance or support area becomes weaker the more times it’s touched, and it is expected that XMR will break out on the next try.

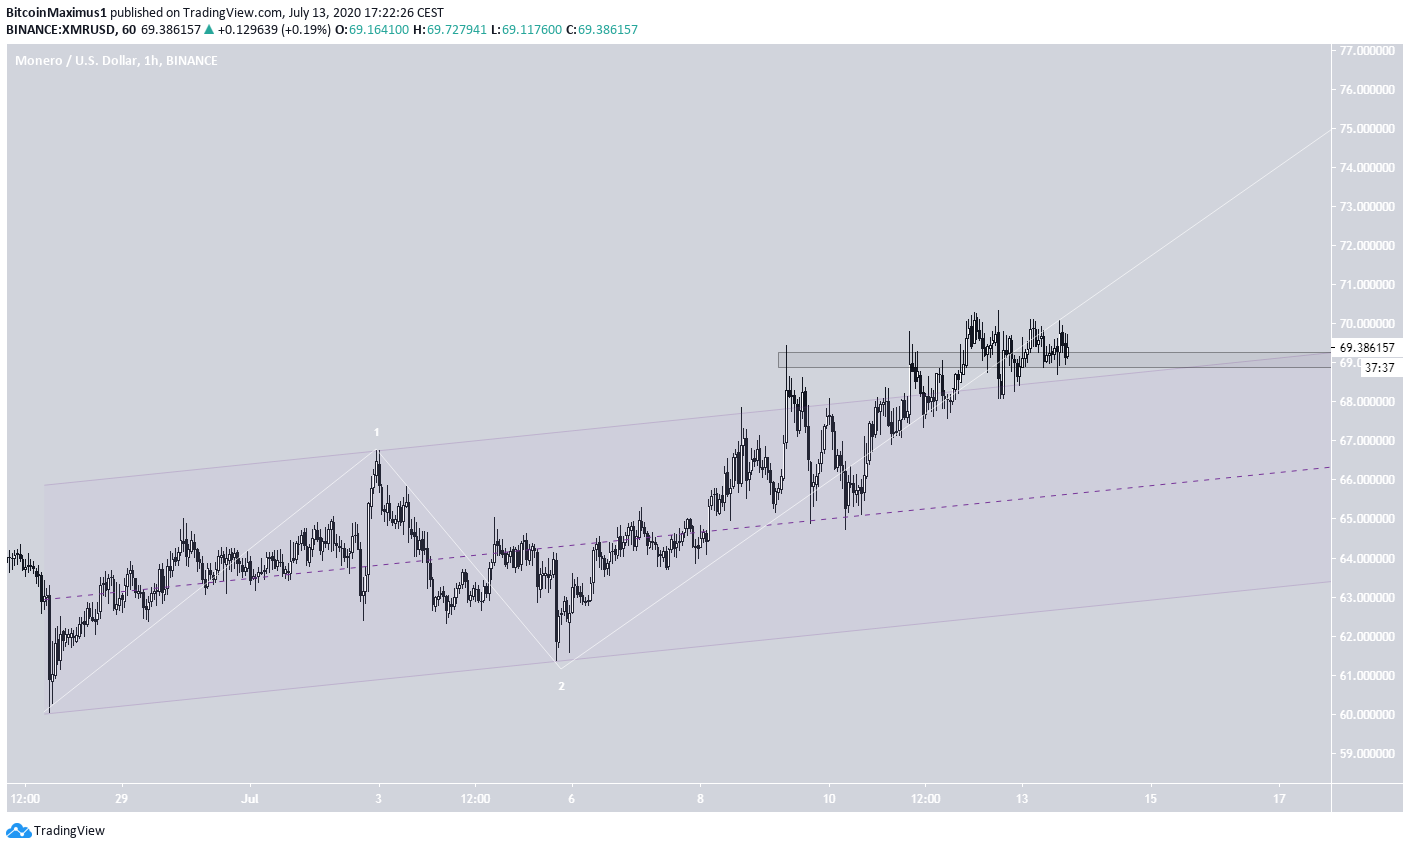
In the short-term, the price has broken out from a parallel ascending channel and is currently trading slightly above its resistance line.
Since corrections are often contained within parallel lines, it is likely that the current movement is an impulse, which would fit with the hypothesis that XMR will break out.
In addition, the XMR price has reclaimed the minor $69 area as support. As long as it is trading above this area and channel, it is expected to continue increasing.

Dash (DASH)
The movement of DASH had been very similar to that of XMR up until the beginning of May when DASH hit a wall and began a corrective movement. Cryptocurrency trader @Glowto1994 stated that the DASH price likely has one more drop to go before it increases.

Since reaching a high on April 29 and validating the $90 area as resistance, the DASH price has been following a descending resistance line. The price broke out from this line on July 7 and has been increasing since.
However, DASH has yet to move above the 200-day MA, which is providing resistance. A breakout above this MA would likely cause another attempt at the $90 resistance area.

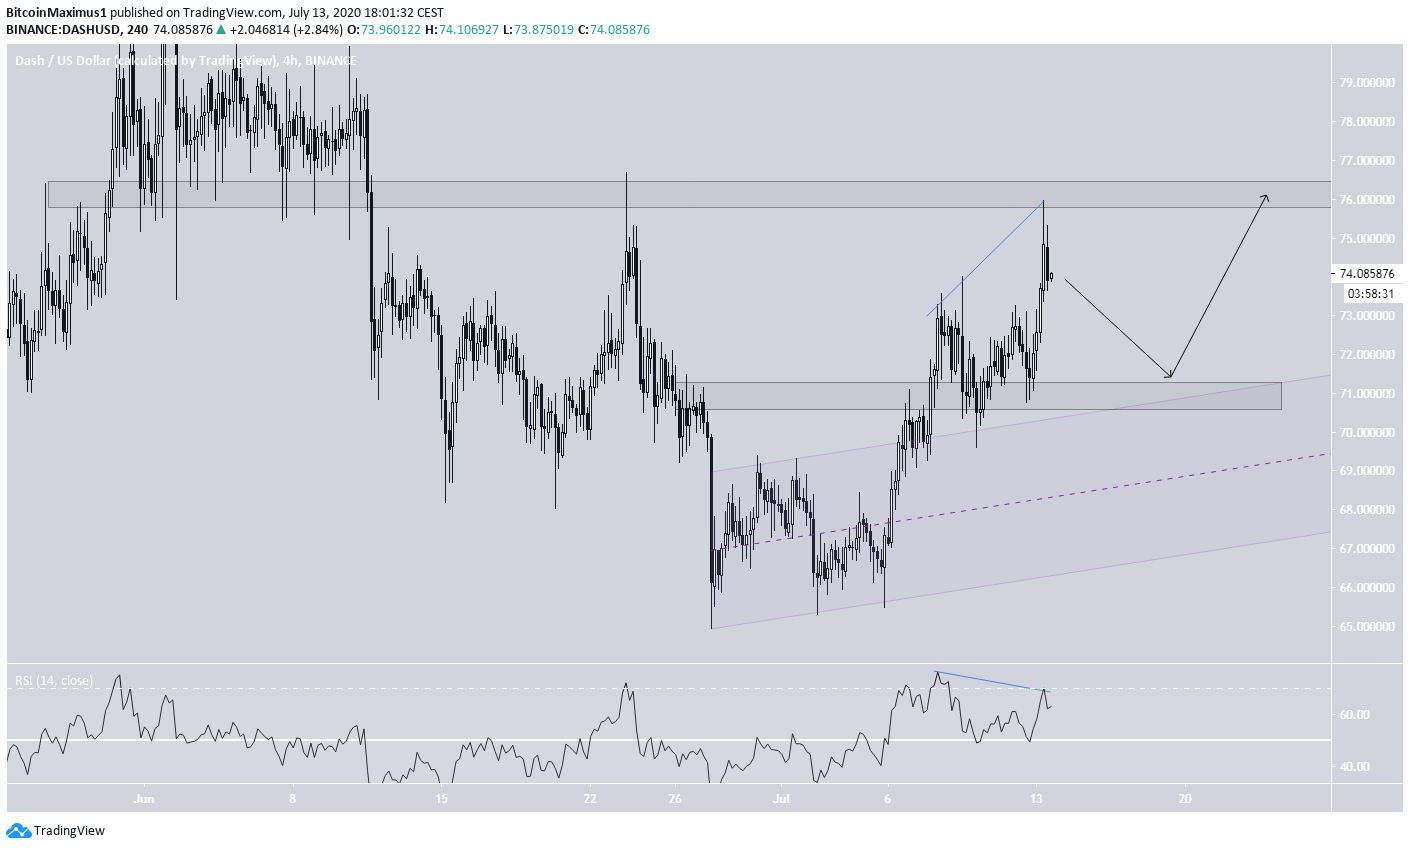
A look at the short-term chart shows a bearish divergence in the RSI, which has developed very close to the $76 resistance area. This indicates that the price is likely to decrease towards the closest support area at $71.
A breakout above $76 would likely cause another accelerated upward move towards the aforementioned $90 resistance area.

Click here for BeInCrypto’s latest Bitcoin analysis!
The post These Two Lagging Major Altcoins Look Primed to Rally appeared first on BeInCrypto.
from BeInCrypto https://beincrypto.com/these-two-lagging-major-altcoins-look-primed-to-rally/


0 Comments