Bitcoin (BTC), the first and largest cryptocurrency by market cap, is a purely decentralized digital currency that saw its inception in 2009. Bitcoin grew since then from practically nothing to hit its all-time highs of $20,000 in December 2017.
Bitcoin has also seen black days as, during the historic market crash in March, it plunged to as low as $3,800 from $7,700 shedding 50% of its value then. Bitcoin however quickly rebounded, as it is noted to have regained all and even more of that which is lost.
In May, Bitcoin had its 3rd halving which saw BTC mining rewards halved from $12.5 BTC to 6.25 BTC. The halving event which is noted as mostly bullish was succeded by month-long consolidation bout.
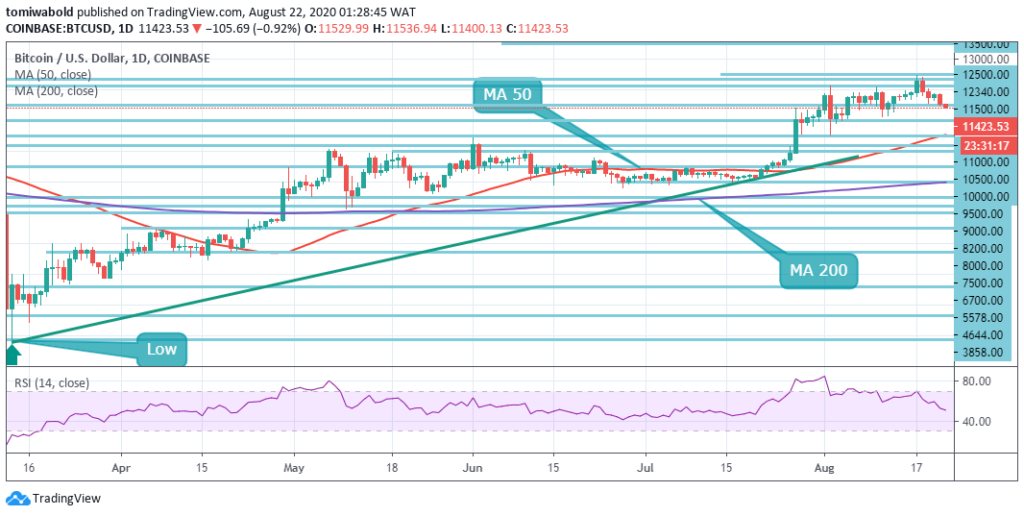
In late July, Bitcoin broke out of this consolidation bout surging past $10,000 level to hit $11,000. In the last few weeks, Bitcoin tested $12,000 while bulls drove prices as high as $12,400 on Monday, setting fresh yearly highs in the process.
 BTC/USD Daily Chart
At the time of writing, Bitcoin (BTC) is trading down at $11,423.
Recent Data Depict Days of Bitcoin (BTC) Trading Under $10K Numbered
Since Bitcoin’s inception in 2009, BTC has not traded above the psychological $10,000 level for an extended period. In the last few weeks, BTC has stayed relatively stable above $10,000.
An analyst who remained incognito as “Hsaka,” noted that this recent bull run is the 4th longest period BTC stayed beyond $10,000. The longest streak was in November 2017 which Bitcoin stayed 63 days followed by June and July 2019, which saw 25 and 28 days respectively.
The impact of Bitcoin’s extended stay beyond $10,000 on the chances of a massive bull trend is yet unknown. But other on-chain data indicate it may contribute to the larger picture.
OKEx recently noted in an analysts’ report that the growing market is seeing $10,000 as a key support level as traders who opened several positions between $6,200 and $9,700 are in the green. It also noted an increase in new positions at $10,000, reducing BTC selling pressure consequently. This is said;
“These observations — together with the apparent lack of downward pressure moving forward and the generally positive market sentiment around this recent price action — suggest that the market’s days of trading Bitcoin under $10K may be numbered.”
The significance of a $10,000 support level to the larger picture is supported by positive fundamental factors, such as steady institutional inflow and increasing Hashrate which indicates the stability of BTC Miners, warding off potential sell-offs.
Recent data indicate Miners are bullish on BTC medium to long term price while data indicates that CME’s Bitcoin futures market’s open interest has hit a new high.
The open interest on Bitcoin (BTC) options contracts has hit $2 billion. Grayscale assets’ worth also hit new ATH above $6.1 billion, indicating growing interest for cryptocurrencies.
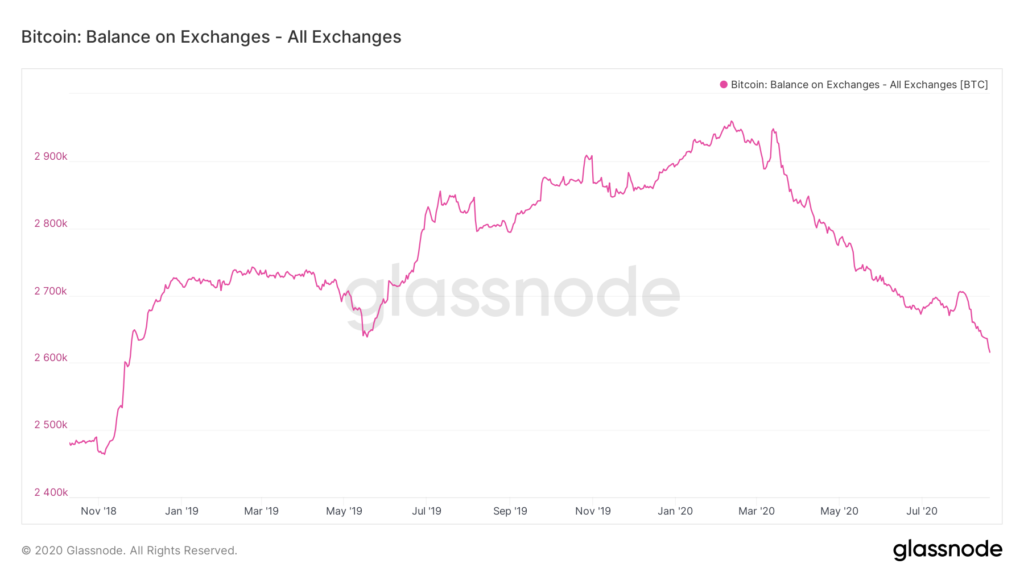
 Bitcoin balances on exchanges. Courtesy: Glassnode.
BTC balances on exchanges recorded a massive drop last seen since 2017 Bitcoin bull run. An analyst stated this may indicate growing confidence amongst BTC Hodlers which is deemed bullish.
According to data from Glassnode, the exchanges it tracks currently hold 2.6 million Bitcoin, a low last seen since November 2018.
The Best Time to Buy Bitcoin Is Now- ‘Rich Dad Poor Dad’ Author
Robert Kiyosaki, a prominent Bitcoin supporter recently stated in a tweet that there is no longer any time to “think about” buying safe-havens like Bitcoin as dollar weakness continues to worsen. He predicted a major banking crisis citing Warren Buffet’s bank stocks dump.
August is seeing fresh concerns over global economic status while institutions see Bitcoin as an opportunity.
Image Credit: Glassnode, Shutterstock
The post Recent Data Indicate Days of Bitcoin (BTC) Trading Under $10K Numbered, Author Says the Best Time to Buy BTC Is Now appeared first on Latest Crypto News.
from Latest Crypto News https://kryptomoney.com/recent-data-indicate-days-of-bitcoin-btc-trading-under-10k-numbered-author-says-the-best-time-to-buy-btc-is-now/


0 Comments