


- Bitcoin bulls are working hard to nurture momentum above $10,300.
- BTC/USD is focused on climbing above $10,400 resistance and grinding to $10,800 after triangle breakout.
Following Bitcoin price breakdown from levels marginally above $12,000, the flagship cryptocurrency has been stuck below $10,400. On the downside, $10,000 is mostly strong support but there are occasions where Bitcoin has dipped to lower levels as far as $9,800. At the time of writing, BTC is doddering at $10,304 after a subtle 0.75% growth in its value on Wednesday, September 10, 2020.
BTC/USD 1-hour chart

Meanwhile, the largest cryptocurrency seems to have settled above the confluence formed by 50 Simple Moving Average (SMA) and the 100 SMA at $10,175 in the hourly range. The immediate hurdle is $10,350 but with the ongoing short term bullish momentum, BTC/USD could soon be on the way to $10,400.
The daily chart, on other hand, shows the difficulty Bitcoin has been facing in its recovery. Despite the effort put in place by the bulls, the bellwether cryptocurrency has not been able to attract the right volume to sustain gains. At the moment, BTC has broken above a falling triangle resistance. Such a move, if accorded proper volume, usually results in majestic price movements.
Read also: Bitcoin Buying Pressure Increasing as Exchanges Hold More Stablecoins
BTC/USD daily chart
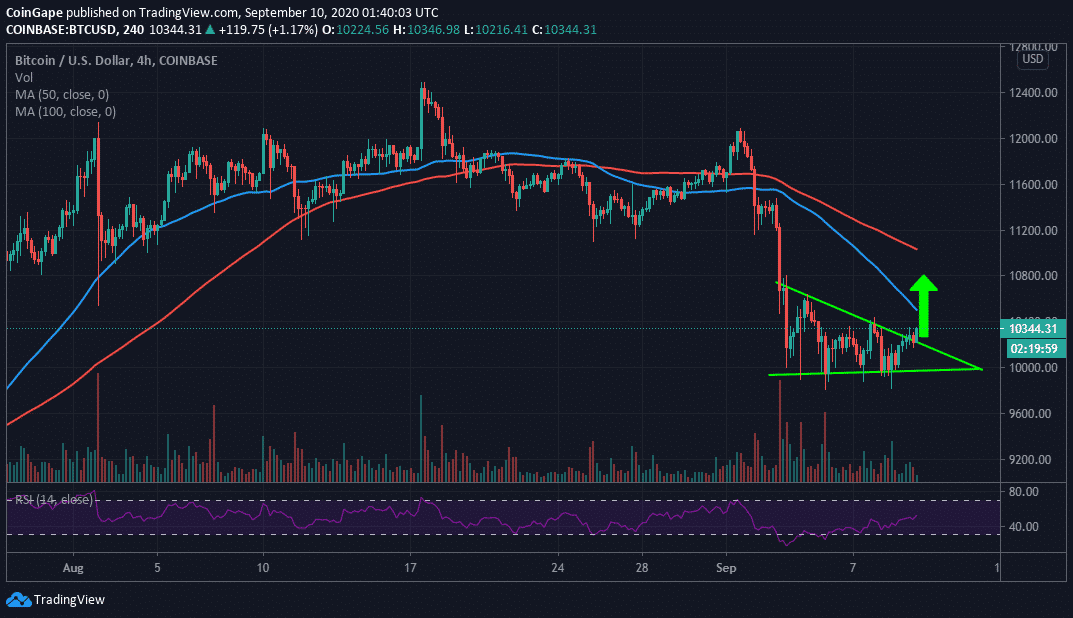
However, all is not lost for the king of digital assets because if buyers can manage to hit levels above the short term hurdle at $10,350, then the journey to $10,400 would be relatively easy. On-chain analysis by IntoTheBlock also highlights $10,400 as significant resistance but also a good inflection point. In other words, if BTC/USD springs above $10,400 then the rise to $10,800 will also be a walk in the park.
Bitcoin Intraday Levels
Spot rate: $10,342
Relative change: 118
Percentage change: 1.18%
Trend: Bullish
Volatility: Expanding
Read more: Bitcoin Price Prediction: BTC Holds In A Range, Is It Time To Buy The Dip?
from Coingape https://coingape.com/74130-2/


0 Comments