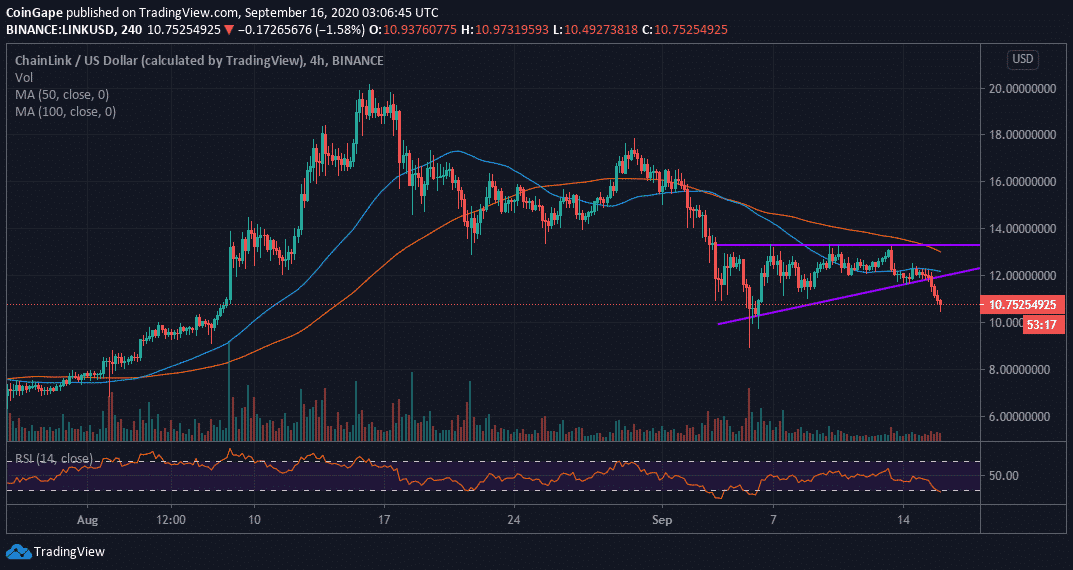
- Chainlink breaks down below an ascending triangle pattern.
- LINK/USD could end up in dire losses, likely to refresh support at $8.85 if support at $10 is broken.
Chainlink has continued to lose dominance in market capitalization and comparison to digital assets like Polkadot, Bitcoin Cash, and Binance Coin. The race for the fifth spot in the market is in full swing, but Chainlink appears to have given up already. At the time of writing, LINK is trading at $10.84 after a 0.81% loss on the day. It is currently the eighth-largest cryptocurrency with a market cap of $3.7 billion.
Ascending Triangle Breakdown
Following the declines September’s first week, Chainlink embraced support at $8.85. A reversal came into play almost immediately, with the price spiking above $10, $12, and $13 resistance levels. Unfortunately, the bullish momentum started to lose strength as bears fought to take back control at $13.30. LINK/USD began to pivoting around $12, although the formation of an ascending triangle recently dealt the bulls a blow.
LINK/USD 4-hour chart

An ascending triangle pattern mainly signals the return of the previous trend. In this case, the breakdown at the beginning of September. However, it is essential to note that a breakout can occur either up or down from the triangle. Meanwhile, the 4-hour chart shows the continuing breakdown below the pattern.
The downtrend is emphasized by the Relative Strength Index (RSI) as dips back into the oversold area. Support at $10 is expected to hold; nevertheless, if it gives in, sellers could increase their activities, in turn, forcing LINK back to support at $8.85.
Chainlink Intraday Levels
Spot rate: $10.84
Relative change: -0.0764
Percentage change: -0.84%
Trend: Bearish
Volatility: Expanding
The post Chainlink Technical Analysis: LINK On The Cusp Of A Breakdown But Can $10 Support Hold? appeared first on Coingape.
from Coingape https://coingape.com/chainlink-technical-analysis-link-on-the-cusp-of-a-breakdown-but-can-10-support-hold/


0 Comments