The Theta (THETA) token price has been moving downward since reaching an all-time high on Sept 30.
While a short-term increase could occur, it seems likely that the price has reached a high for the foreseeable future.
Ongoing Decrease
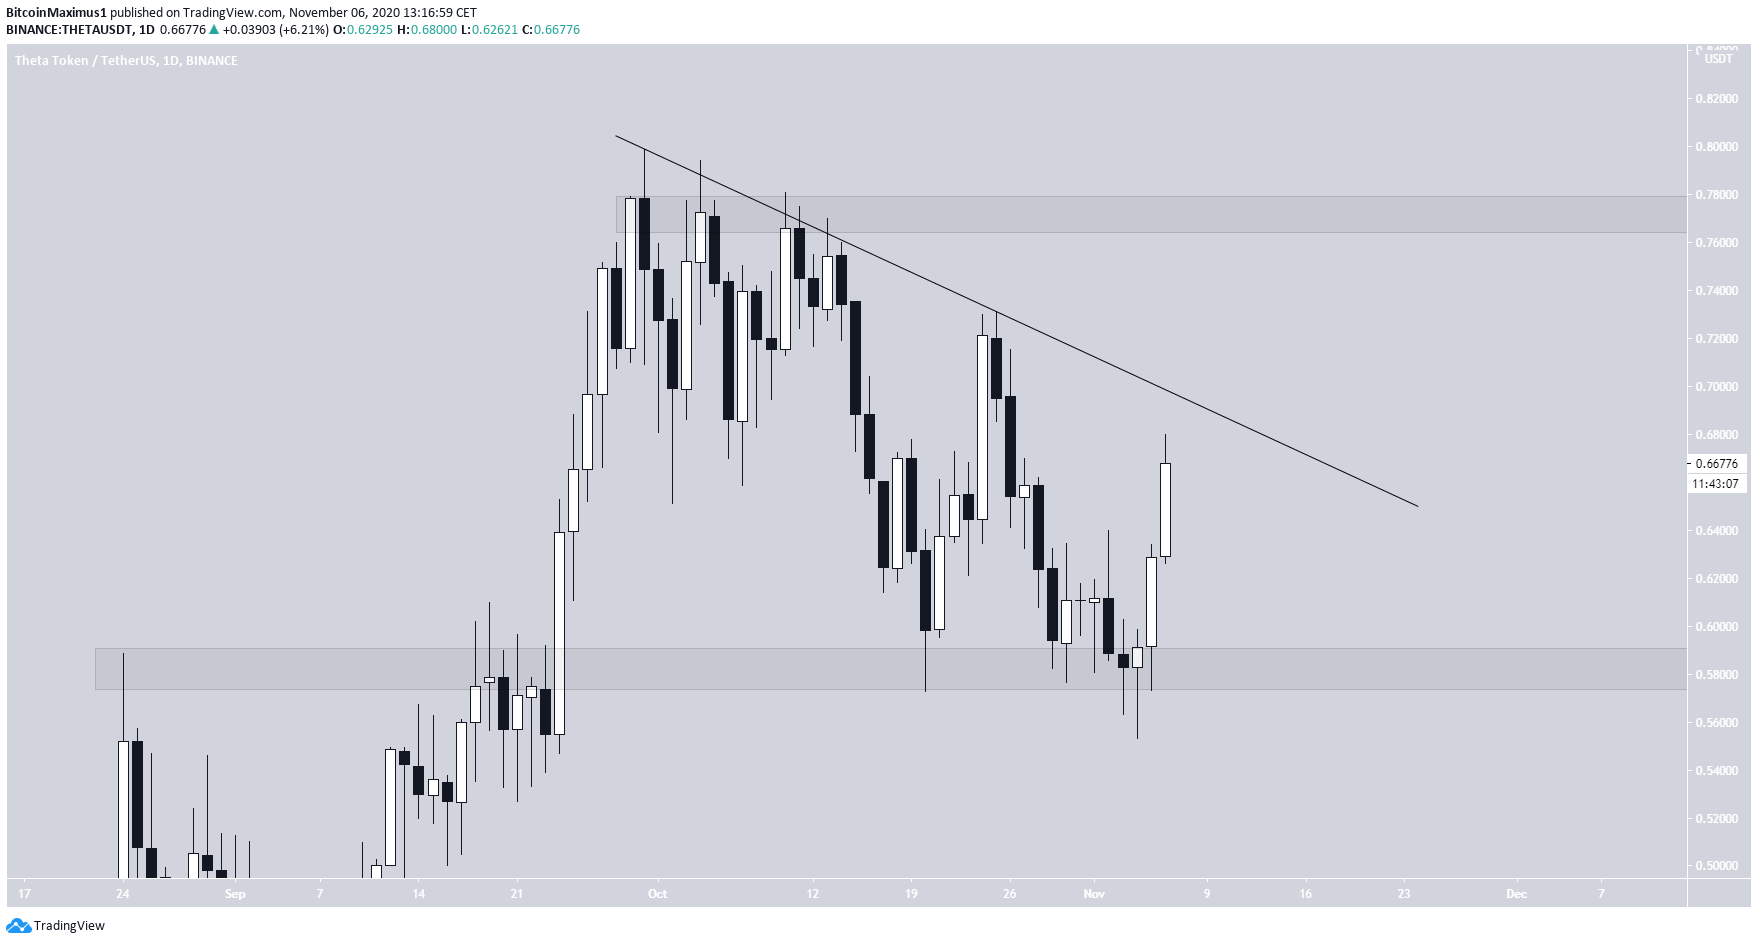
THETA has been gradually decreasing alongside a descending resistance line since it reached an all-time high price of $0.798 on Sept 30.
The price reached a low of $0.553 on Nov. 4, which served to validate the $0.57 area as support and began to increase. However, the price has yet to break out from the descending resistance line. If successful in doing so, it could move upwards all the way to the next resistance area at $0.78.
Long-Term Weakness
The short-term chart does not show clear weakness yet, but technical indicators have already reached overbought territory.
Furthermore, the price is approaching a minor resistance area near $0.695, which coincides with the aforementioned descending resistance line, making it likely to act as the short-term top.
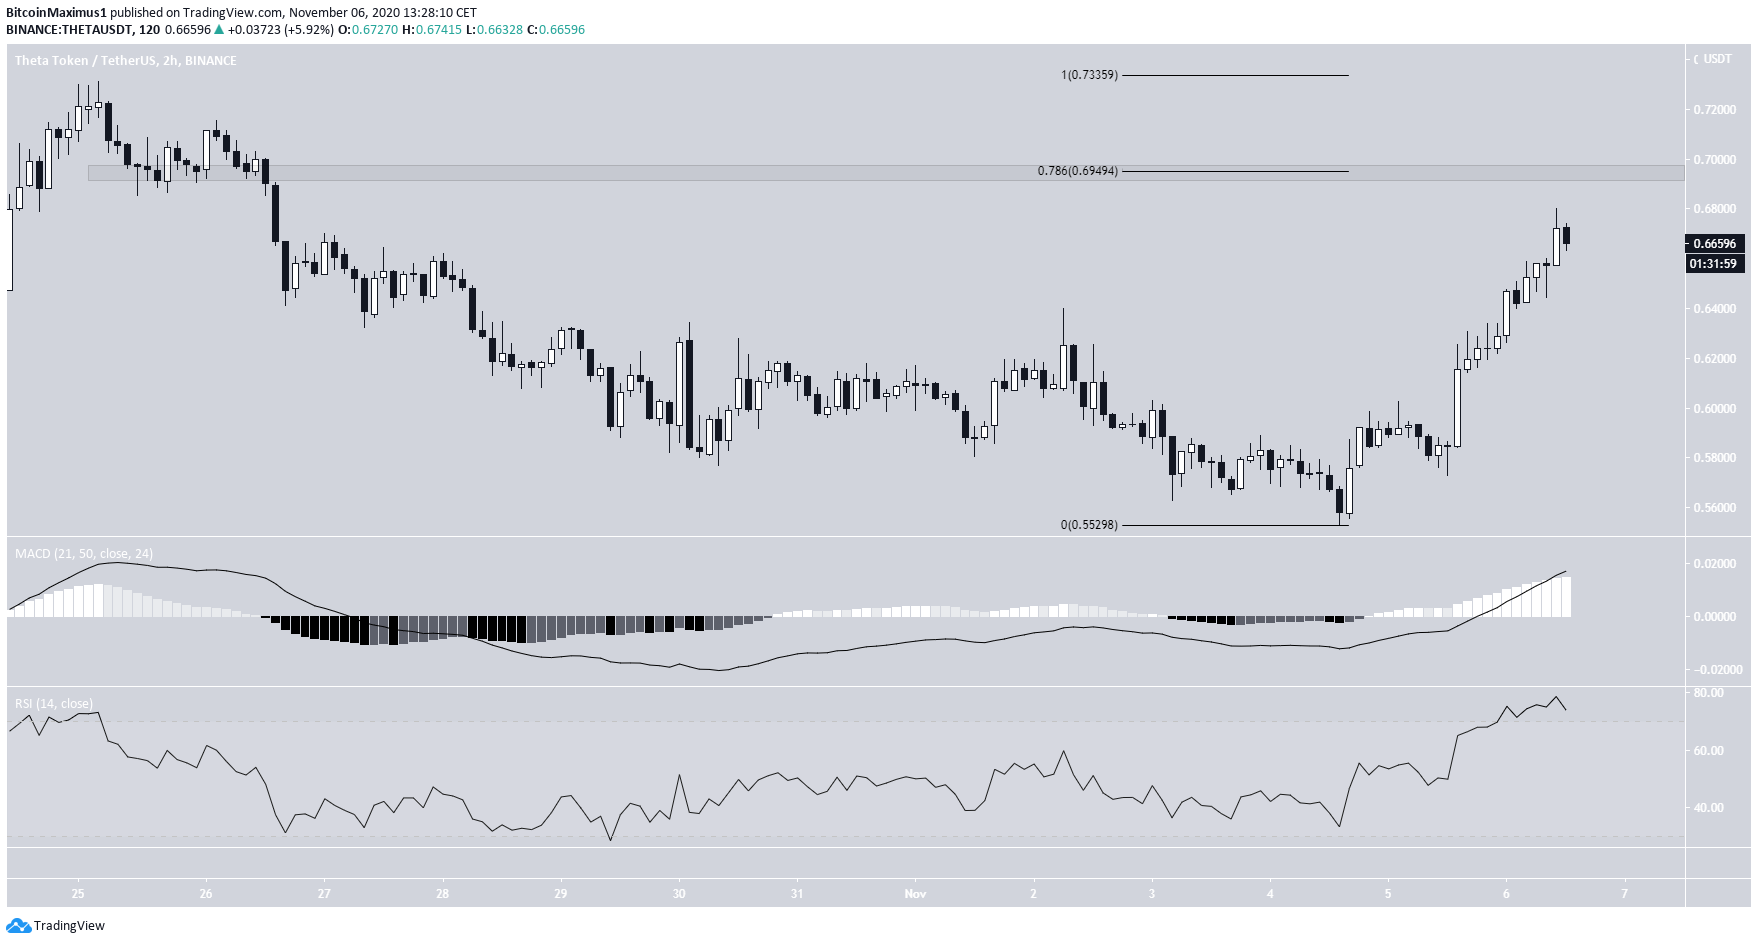
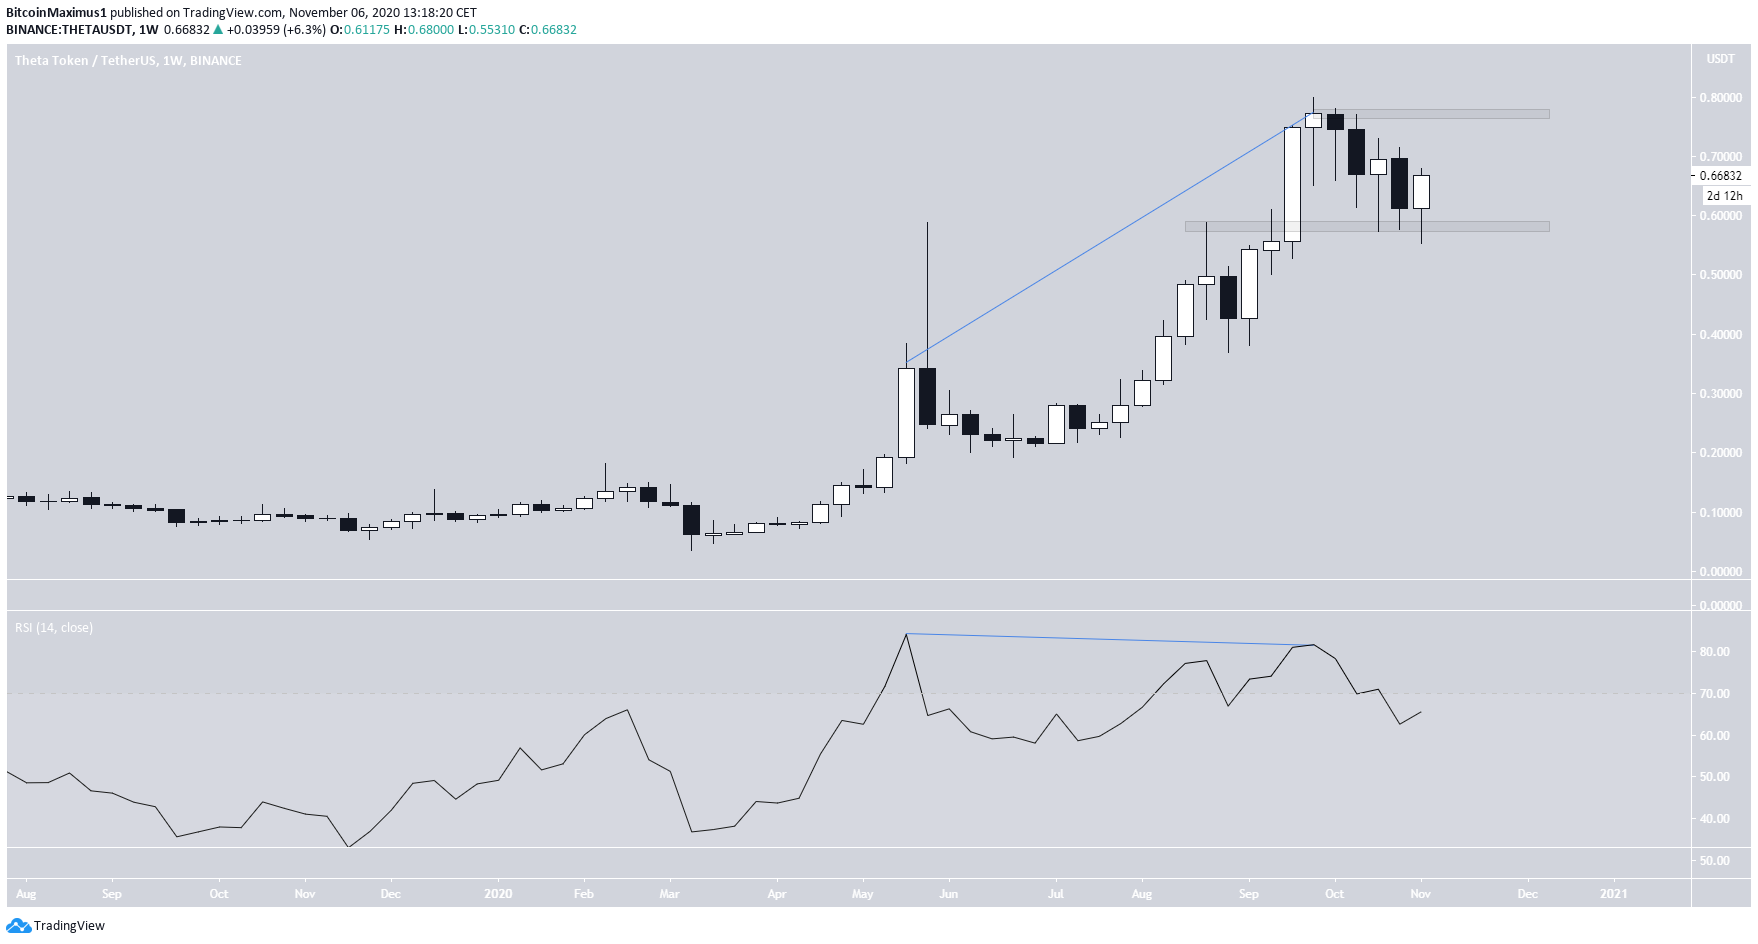
The weekly chart is clearly bearish since there is a very pronounced bearish divergence in the RSI, which just crossed down from its overbought territory.
Therefore, while a breakout from the descending resistance line could occur, a reclaim of the $0.78 resistance area seems unlikely.
Wave Count
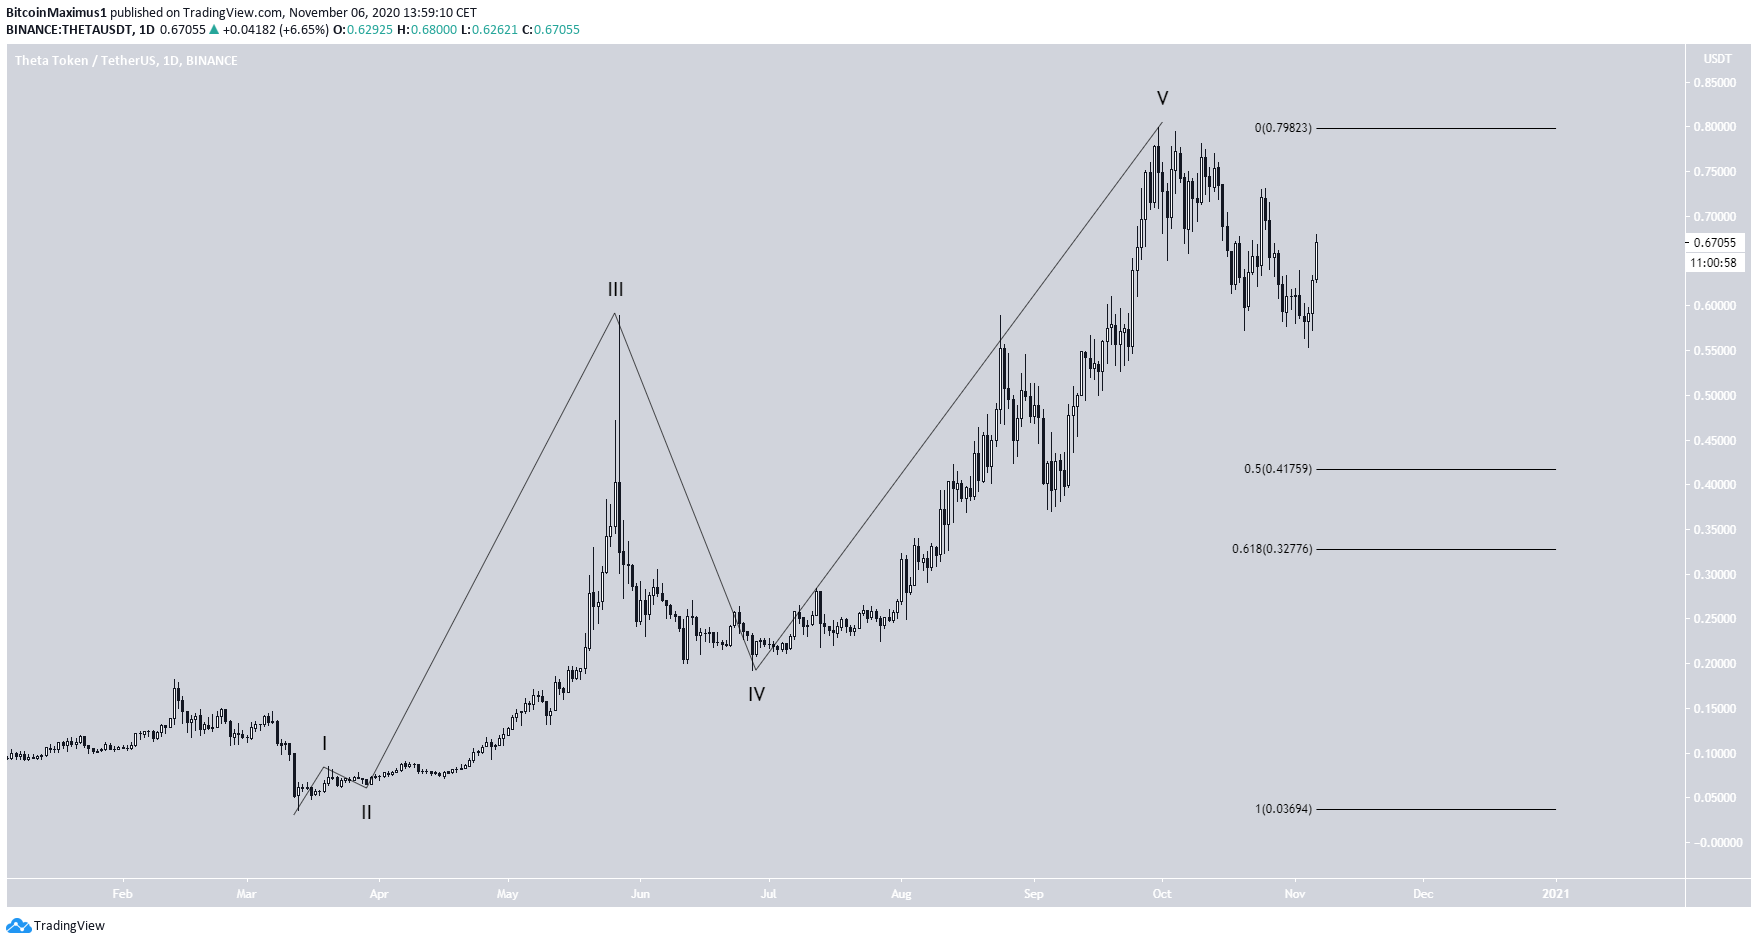
It is possible that the THETA price has completed a bullish five-wave formation (shown in black below), measuring from the March 13 lows.
If correct, the price has now begun a lengthy correction which could take it all the way between $0.32-$0.41. This would fit perfectly with the long-term bearish divergence in place.
An increase above the current all-time high price of $0.798 would invalidate this possibility.
THETA/BTC
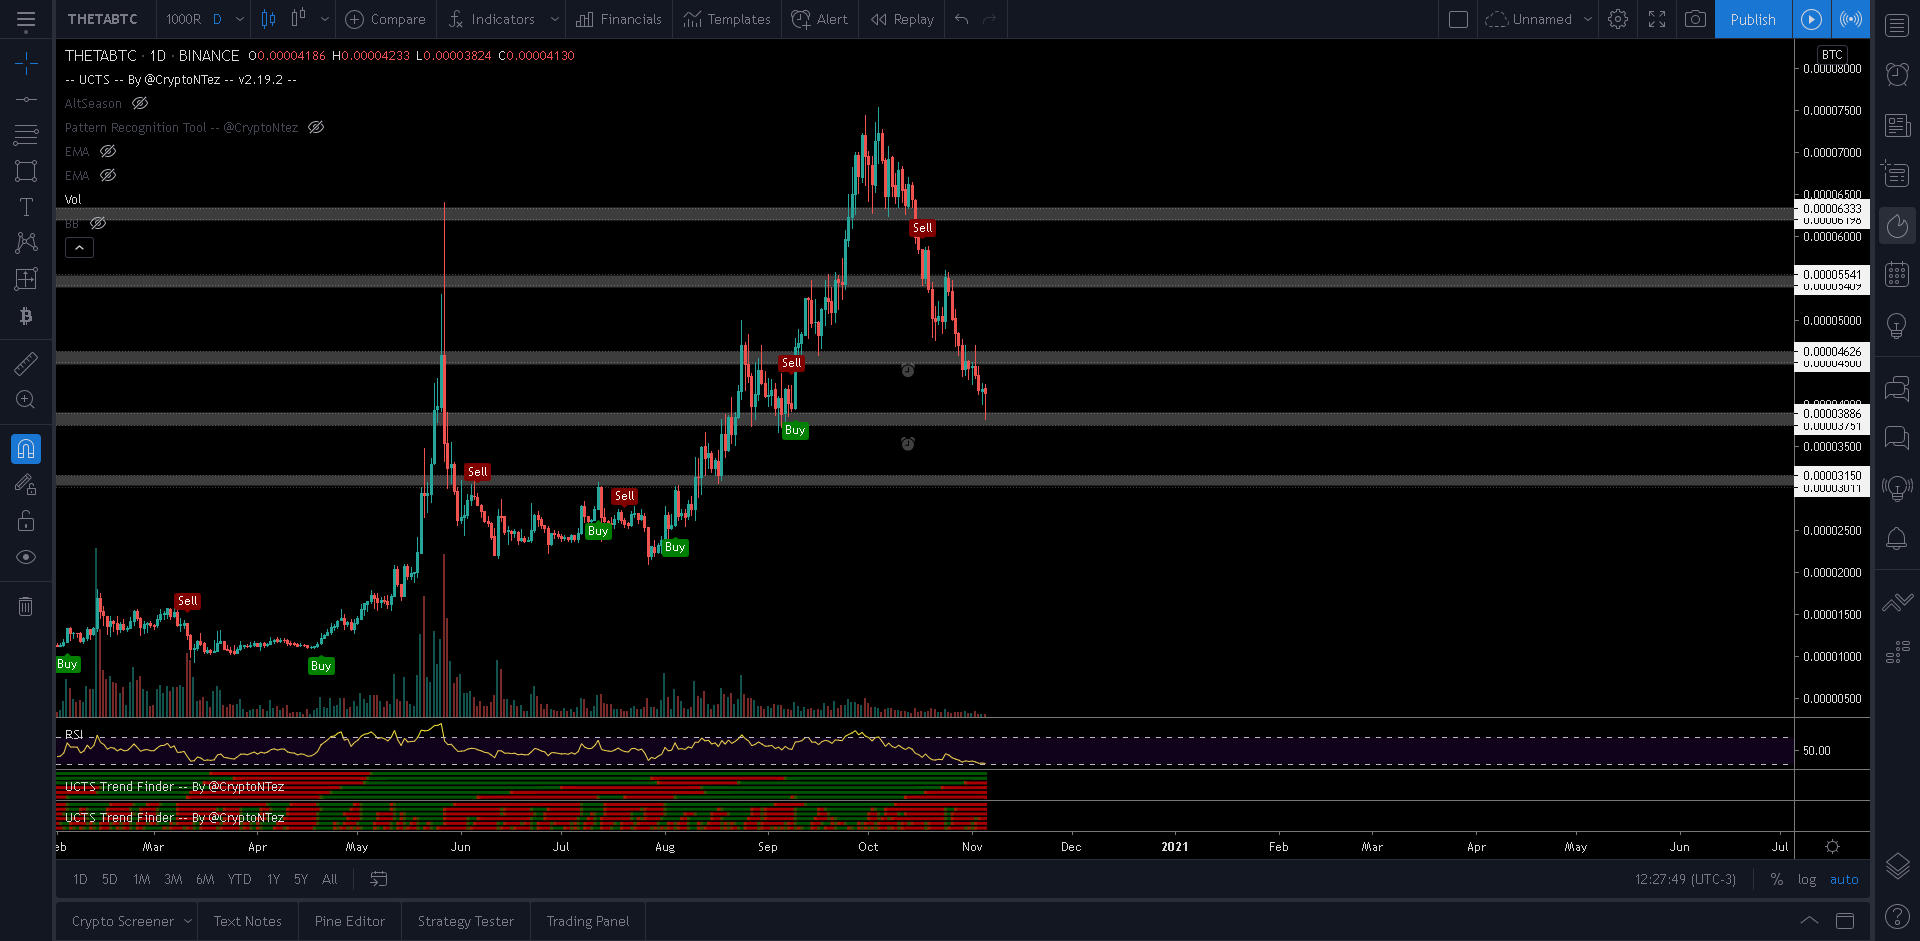
Cryptocurrency trader @CryptoNTez outlined a THETA chart which shows the price resting inside a minor support area.
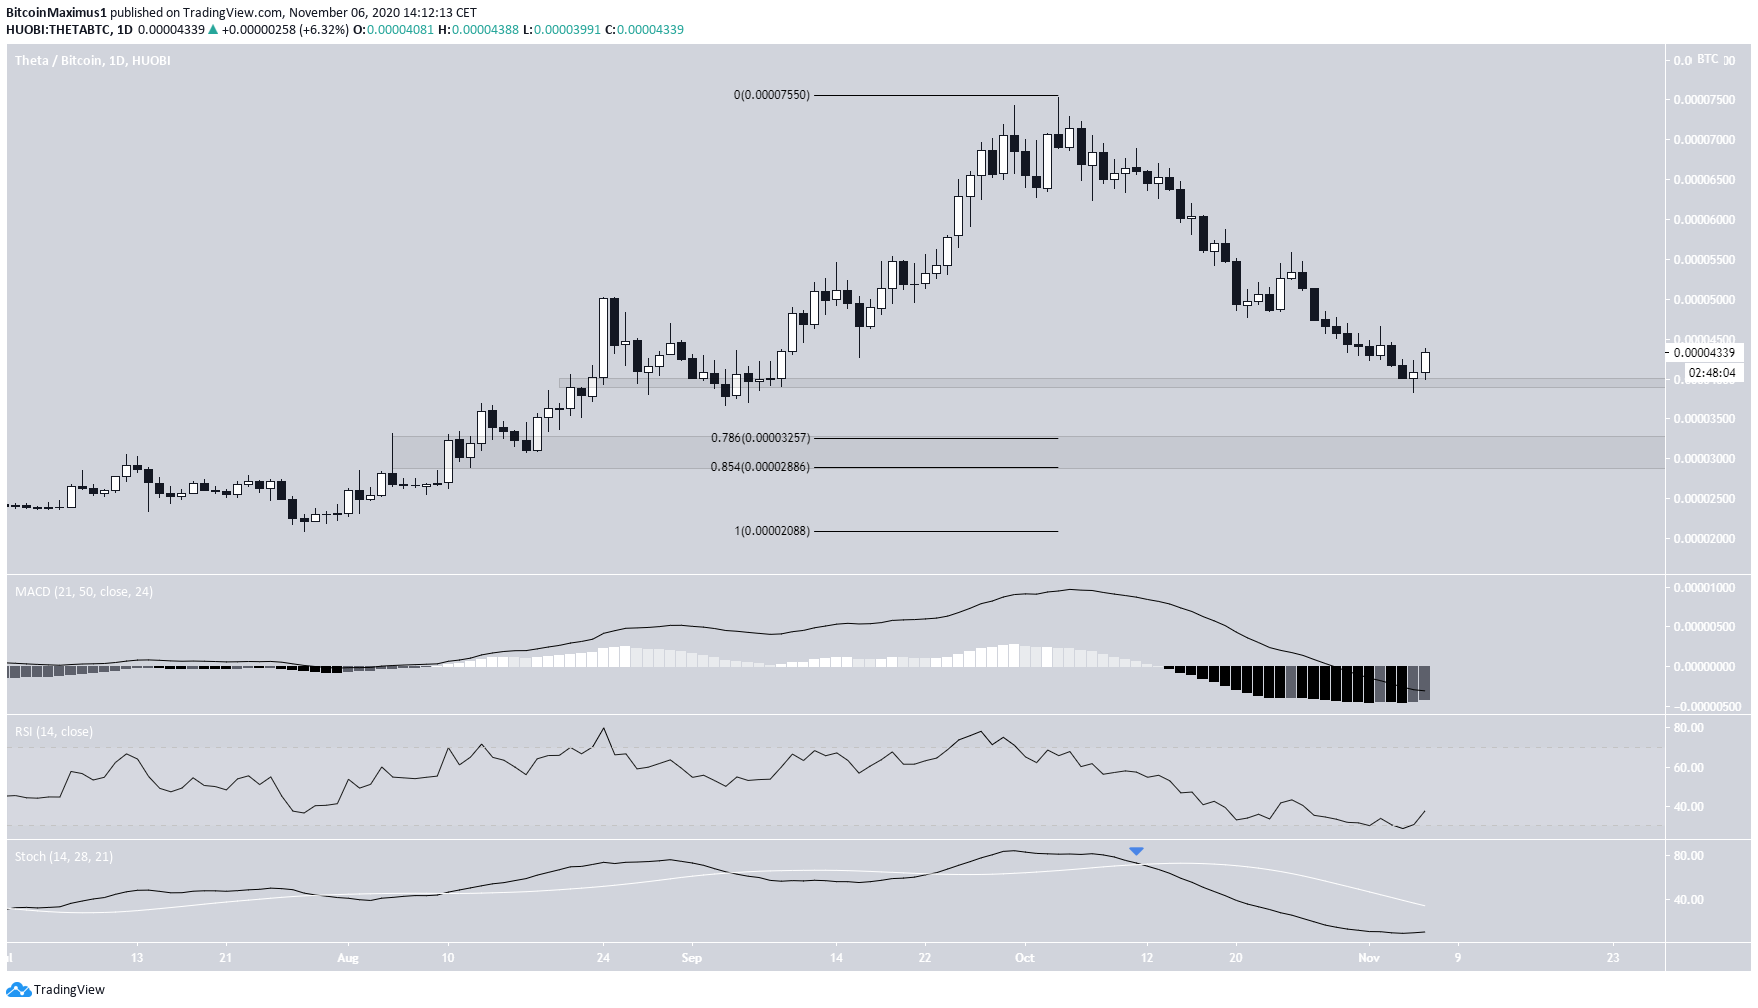
While the price has indeed bounced at the 3,950 satoshi support area, there are no clear bullish reversal signs yet, since the MACD is below 0, the RSI is below 50 and the Stochastic Oscillator has made a bearish cross. There are no bullish divergences present in either indicator.
Therefore, it is more likely that the current increase is a relief rally rather than the beginning of a new upward movement. After it’s done, the price would be expected to fall towards 2,900-3,200 satoshis.
Conclusion
Both the THETA/USD and THETA/BTC pairs look likely to have made a top and are expected to continue decreasing in the medium to long term.
For BeInCrypto’s previous Bitcoin analysis, click here!
Disclaimer: Cryptocurrency trading carries a high level of risk and may not be suitable for all investors. The views expressed in this article do not reflect those of BeInCrypto.
The post THETA Drops Sharply After Reaching All-Time High appeared first on BeInCrypto.
from BeInCrypto https://beincrypto.com/theta-drops-sharply-after-reaching-all-time-high/


0 Comments