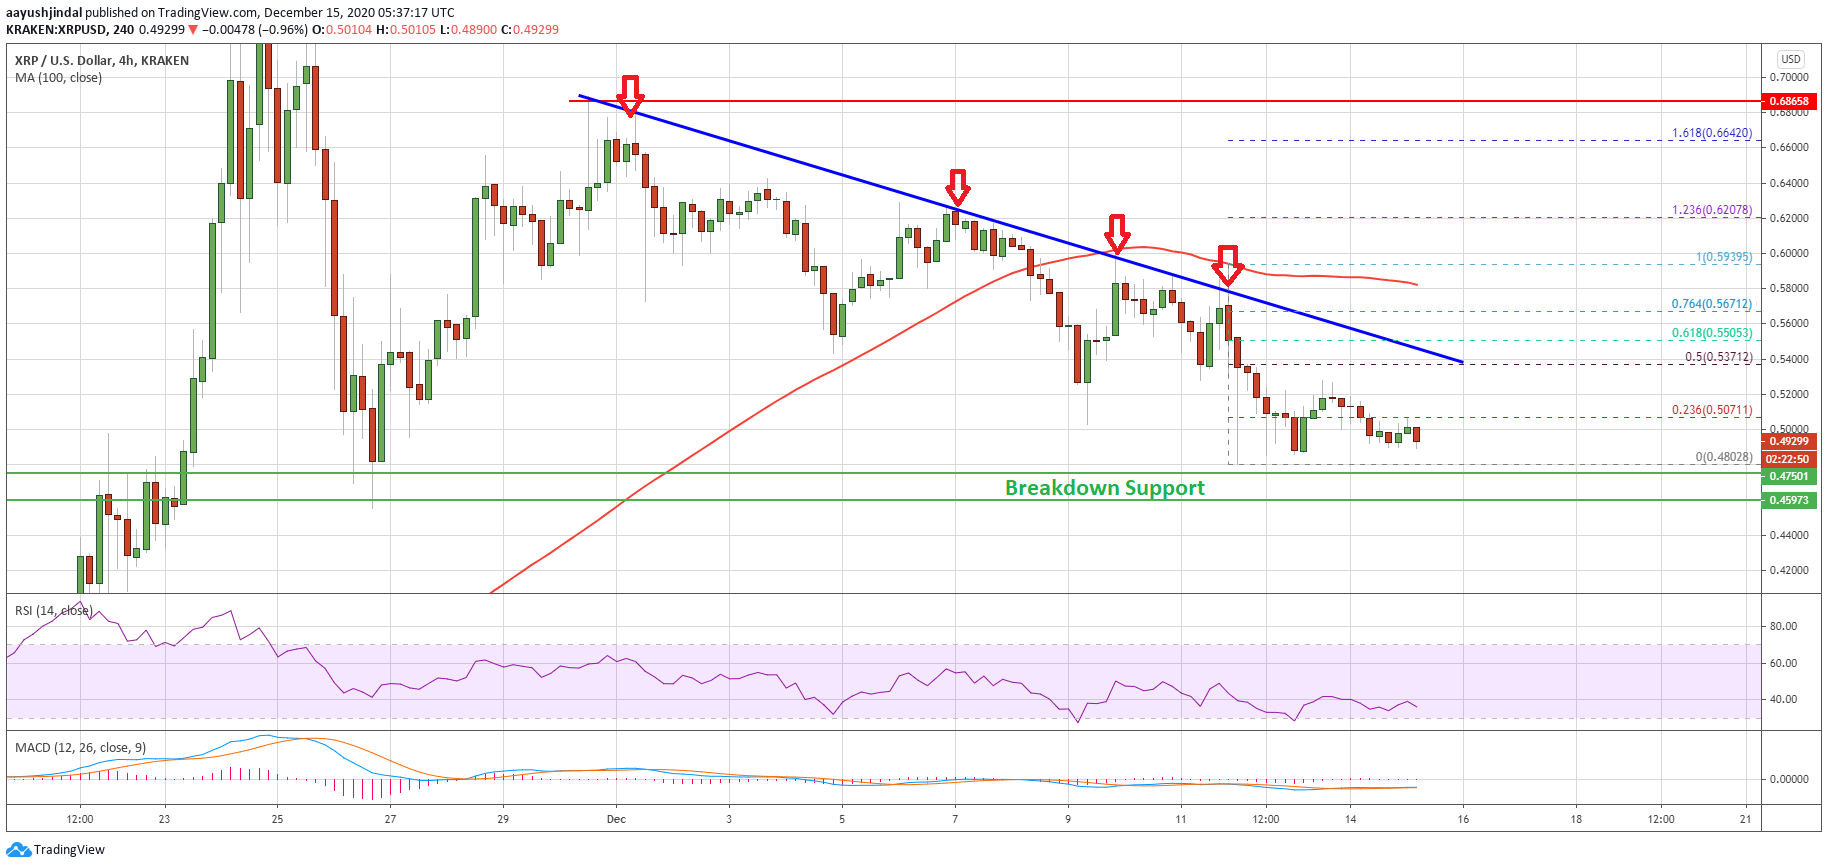
Ripple is struggling to settle above $0.5000 and slowly declining against the US Dollar. XRP price must stay above $0.4800 and $0.4750 to avoid a major downside break.
- Ripple formed a swing high near $0.5940 and declined below $0.5200 against the US dollar.
- The price is now trading below the $0.5000 zone and the 100 simple moving average (4-hours).
- There is a crucial bearish trend line forming with resistance near $0.5370 on the 4-hours chart of the XRP/USD pair (data source from Kraken).
- The pair is slowly moving towards a significant support at $0.4800 and $0.4750.
Ripple’s XRP Price is Showing Bearish Signs
In the past few days, ripple’s XRP price made many attempts to gain momentum above $0.6000, but it failed. There were many failures noted near $0.6000 and the 100 simple moving average (4-hours).
The price is currently declining and trading well below the $0.5200 pivot level. The last swing high was formed near $0.5939 before there was a drop below $0.5000. A low is formed near $0.4800 and the price is currently consolidating losses.
Recently, there was a fresh increase in bitcoin and Ethereum, but upsides were capped in XRP above $0.5200. There was a break above the 23.6% Fib retracement level of the downward move from the $0.5939 high to $0.4802 swing low.
Source: XRPUSD on TradingView.com
On the upside, the first major resistance is near the $0.5200 level. The next major resistance is near the $0.5380 level. There is also a crucial bearish trend line forming with resistance near $0.5370 on the 4-hours chart of the XRP/USD pair.
The trend line is close to the 50% Fib retracement level of the downward move from the $0.5939 high to $0.4802 swing low. A close above $0.5200 and $0.5400 could open the doors for a strong increase in the coming days. The next major resistance is still near the $0.6000 level.
Downside Break in XRP?
If ripple fails to correct above $0.5200, it could continue to move down. The first major support is near the $0.4800 and $0.4750 levels.
A downside break below the $0.4750 level could spark a major decline below the $0.4500 support. In the stated case, the price could dive towards the $0.4200 support.
Technical Indicators
4-Hours MACD – The MACD for XRP/USD is gaining momentum in the bearish zone.
4-Hours RSI (Relative Strength Index) – The RSI for XRP/USD is currently well below the 40 level.
Major Support Levels – $0.4800, $0.4750 and $0.4500.
Major Resistance Levels – $0.5200, $0.5380 and $0.5400.
from NewsBTC https://www.newsbtc.com/analysis/xrp/ripple-xrp-make-or-breaks-levels-047/


0 Comments