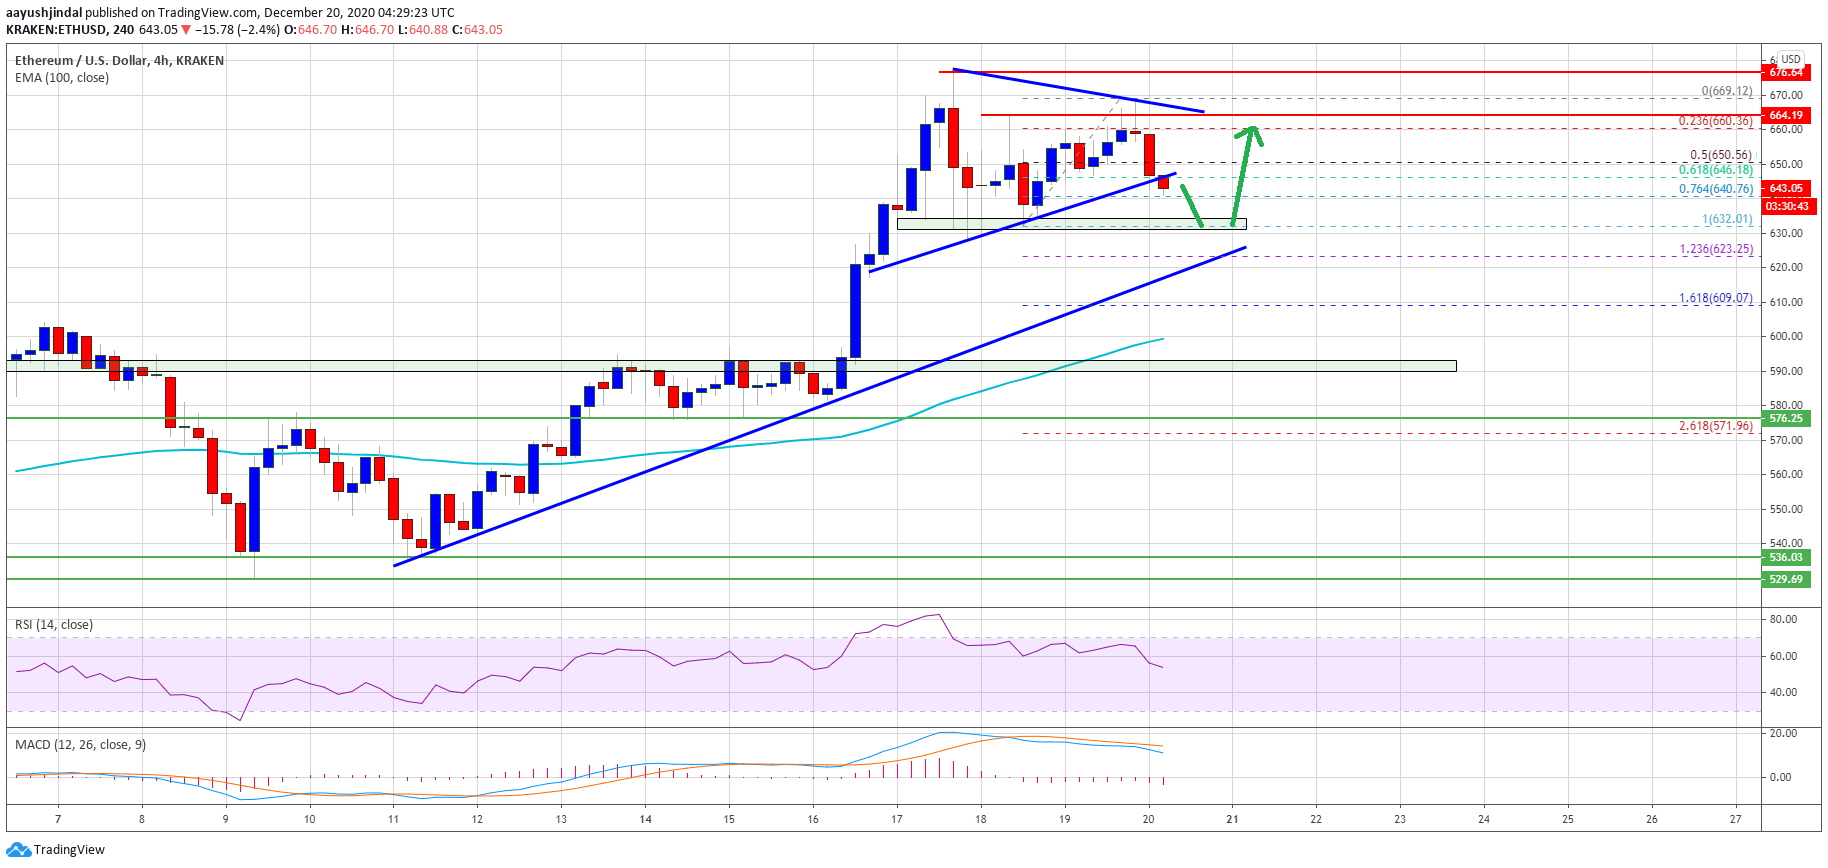
Ethereum rallied above $650 and $660 before correcting lower against the US Dollar. ETH price is likely to remain supported and it might start a fresh increase towards $700.
- ETH price gained pace after it broke the $650 resistance against the US Dollar.
- The price is currently correcting lower from $670 and trading well above the 100 simple moving average (4-hours).
- There is a key bullish trend line forming with support near $624 on the 4-hours chart of ETH/USD (data feed via Kraken).
- The pair could rise again as long as it is trading above the $620 support zone.
Ethereum’s Ether Remains In Uptrend
This past week, bitcoin and ethereum saw a significant rally above $600 and $20,000 respectively against the US Dollar. ETH price even surpassed the $630 resistance zone and settled well above the 100 simple moving average (4-hours).
Ether price gained pace above the $650 resistance and it traded to a new yearly high above $670. Recently, there was a downside correction below the $660 and $650 levels.
The price broke the 50% Fib retracement level of the recent rally from the $632 swing low to $660 swing high. At the moment, the bears are attempting a downside break below a major contracting triangle with support near $645 on the 4-hours chart of ETH/USD.
The next key support is near the $640 level. It is close to the 76.4% Fib retracement level of the recent rally from the $632 swing low to $660 swing high.
Source: ETHUSD on TradingView.com
On the upside, an initial resistance is near the $660 level. The first major resistance is near the triangle upper trend line at $665. A successful close above the $660 and $665 level may possibly open the doors for more upsides above $670. The next major stop for the bulls could be $700.
Dips Supported in Ether (ETH)?
If Ethereum fails to clear the $660 and $665 resistance levels, there is a risk of short-term decline. An initial support is near the $640 level.
The main support is forming near the $620 level. There is also a key bullish trend line forming with support near $624 on the same chart. Any more losses could lead the price towards $600.
Technical Indicators
4 hours MACD – The MACD for ETH/USD is slowly gaining momentum in the bearish zone.
4 hours RSI – The RSI for ETH/USD is still well above the 50 level.
Major Support Level – $620
Major Resistance Level – $665
from NewsBTC https://www.newsbtc.com/analysis/eth/ethereum-eth-could-rally-to-700/


0 Comments