Stellar (XLM) started a strong increase above the $0.1350 resistance against the US Dollar. XLM price is trading nicely above $0.1500 and it could continue to rise towards $0.1800 or $0.2000.
- There was a steady increase in stellar’s token price above $0.1350 against the US dollar.
- The traded close to the $0.1680 resistance and settle above the 100 simple moving average (4-hours).
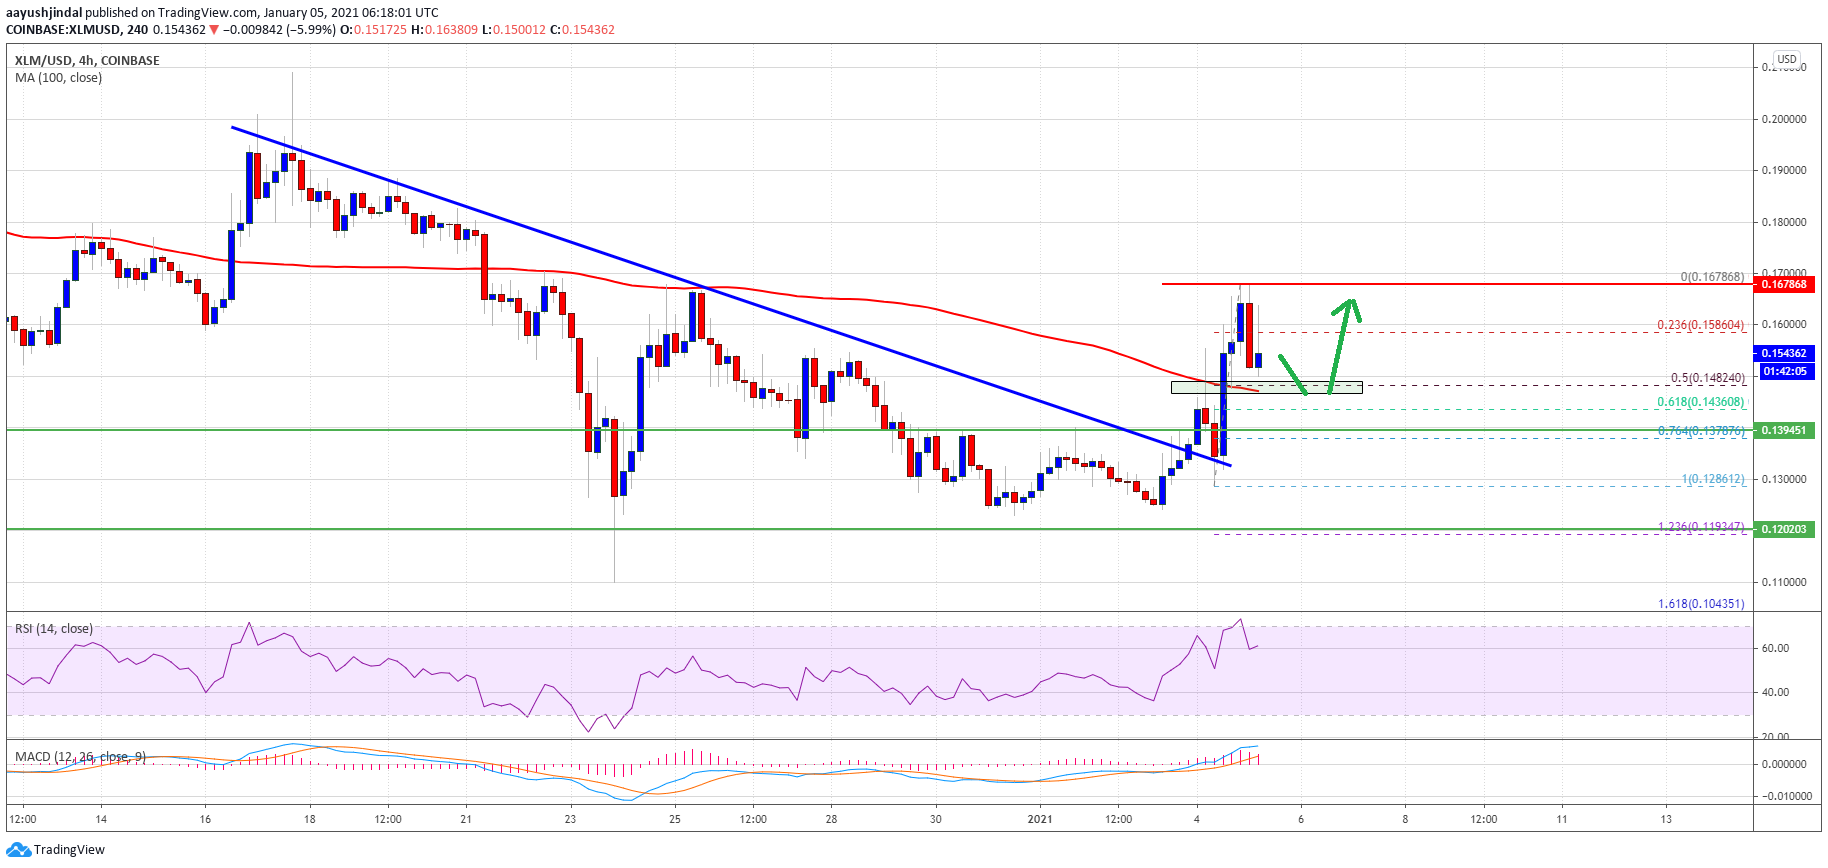
- There was a break above a crucial bearish trend line with resistance near $0.1367 on the 4-hours chart of the XLM/USD pair (data source from Coinbase).
- The pair is likely to continue higher towards $0.1800 and $0.2000 as long as it is above $0.1400.
Stellar (XLM) is Showing Positive Signs
After forming a strong support base above $0.1200, stellar (XLM) saw a strong increase above $0.1300 against the US Dollar, while bitcoin and Ethereum saw a downside correction.
There was a clear break above the $0.1350 and $0.1380 resistance levels. There was also a break above a crucial bearish trend line with resistance near $0.1367 on the 4-hours chart of the XLM/USD pair. The price rallied above the $0.1500 level and settled above the 100 simple moving average (4-hours).
The price traded as high as $0.1678 and it is currently correcting lower. There was a break below the 23.6% Fib retracement level of the recent increase from the $0.1286 low to $0.1678 high.
Source: XLMUSD on TradingView.com
The price is now approaching the $0.1500 support zone. It is close to the 50% Fib retracement level of the recent increase from the $0.1286 low to $0.1678 high. On the upside, the $0.1550 and $0.1580 levels are important hurdles. A close above the recent high might increase the chances of a steady increase towards the $0.1650 and $0.1720 levels. The next major stop could be $0.1800 or even $0.2000.
Dips Supported in XLM?
If XLM price struggles to continue higher, it could test the $0.1480 support. The 100 simple moving average (4-hours) is also sitting near the $0.1480 level to act as a strong support.
A clear break below the $0.1480 support zone could spark a fresh decline. The next major support on the downside is near the $0.1300 level.
Technical Indicators
4-hours MACD – The MACD for XLM/USD is gaining pace in the bullish zone.
4-hours RSI (Relative Strength Index) – The RSI for XLM/USD is currently well above the 50 level.
Major Support Levels – $0.1500, $0.1480 and $0.1300.
Major Resistance Levels – $0.1550, $0.1580 and $0.1800.
from NewsBTC https://www.newsbtc.com/analysis/xlm/stellar-xlm-prints-bullish-breakout-0-20/


0 Comments